
Biochemistry
9th Edition
ISBN: 9781319114671
Author: Lubert Stryer, Jeremy M. Berg, John L. Tymoczko, Gregory J. Gatto Jr.
Publisher: W. H. Freeman
expand_more
expand_more
format_list_bulleted
Related questions
Question
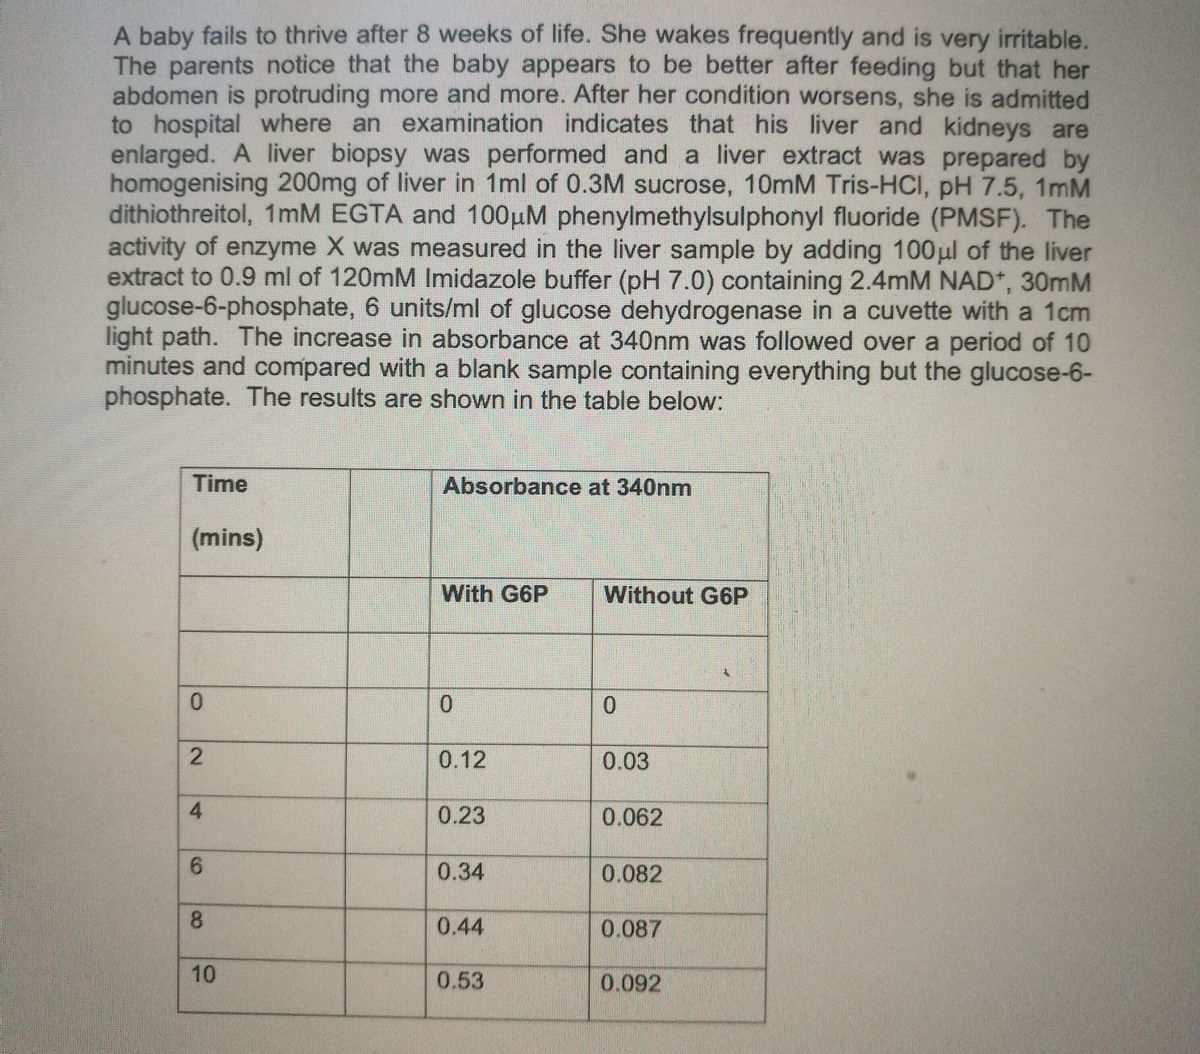

Transcribed Image Text:A baby fails to thrive after 8 weeks of life. She wakes frequently and is very irritable.
The parents notice that the baby appears to be better after feeding but that her
abdomen is protruding more and more. After her condition worsens, she is admitted
to hospital where an examination indicates that his liver and kidneys are
enlarged. A liver biopsy was performed and a liver extract was prepared by
homogenising 200mg of liver in 1ml of 0.3M sucrose, 10mM Tris-HCl, pH 7.5, 1mM
dithiothreitol, 1mM EGTA and 100μM phenylmethylsulphonyl fluoride (PMSF). The
activity of enzyme X was measured in the liver sample by adding 100μl of the liver
extract to 0.9 ml of 120mM Imidazole buffer (pH 7.0) containing 2.4mM NAD+, 30mM
glucose-6-phosphate, 6 units/ml of glucose dehydrogenase in a cuvette with a 1cm
light path. The increase in absorbance at 340nm was followed over a period of 10
minutes and compared with a blank sample containing everything but the glucose-6-
phosphate. The results are shown in the table below:
Time
(mins)
0
2
4
6
8
10
Absorbance at 340nm
With G6P
0
0.12
0.23
0.34
0.44
0.53
Without G6P
0
0.03
0.062
0.082
0.087
0.092

Transcribed Image Text:2. Draw a graph to calculate the initial rate of reaction due to enzyme X in
absorbance units/min/100μl of extract.
Expert Solution
This question has been solved!
Explore an expertly crafted, step-by-step solution for a thorough understanding of key concepts.

Step by stepSolved in 2 steps with 2 images

Knowledge Booster

Similar questions
- Outline the steps involved in the two paths of sulfate assimilation. Be sure to address the sulfur reduction pathway as a photoassimilation process.arrow_forward2. The enzymatic reaction rate r is given by equation 2 below as a function of substrate concentration Cs and kinetics parameters KM and rmax. Using linear and nonlinear regression in excel, evaluate the kinetic parameter constants of a biosystem given the gathered data from a series of batch runsarrow_forward1. How many mL of sterile water must be added to make the preparation isotonic? 2. How many mL of another isotonic solution must be added to make the final volume of the solution?arrow_forward
- 3. How would you use a 3-step serial dilution to produce 1ml of a luM Glucose solution from a 1M Glucose stock? What would be the total dilution factor?arrow_forwardSUBSTRATE CONCENTRATION [S] µM INITIAL VELOCITY V0 s-1 10 0.13 25 0.27 50 0.45 100 0.65 150 0.77 200 0.85 300 0.94 500 1.03 (i) a) Construct an empty table with the following column headings: Substrate concentration [S] and initial velocity (Vi) where [S] has the unit µM, and Vi has the unit mM/s. (ii) The table provided is the enzyme kinetic data for your mutated enzyme, whereby Vi was expressed using the unit ∆A(405 nm)/s. Using the standard curve, express Vi with the unit mM/s rather than ∆A(405 nm)/s. Place your answer in the table above alongside the appropriate [S]. Hint: To answer this question you need to use this standard curve equation=0.0419x (The slope of the line is= 0.0419) (iii) The unmutated form of your protein has a Km of 25 µM and a Vmax of 43 mM/s. The enzyme kinetic data for your enzyme with the amino acid substitution should now be displayed in the table above. Based on these data, what is Vmax? Km? and…arrow_forward) The Chemical Solution lambda max Camax) ofa should be determined by absorbtion spectum 9) The standard curre Lambs Enzyme reaction_arrow_forward
- ● • 24) Determine the fraction of Vmax that would be found at a substrate concentration of ½2 Km, 2 Km and 10 Km.arrow_forward1-. How would the extraction efficiency change if you changed the solvent from hexane to a more polar solvent like 1-chlorohexidine? 2-The cell wall of the microalgae is polar, can we use our method to extract lipids from microalgae?arrow_forwardPlot absorption versus time using the graph label mAbs vs time(s) from 0 to 120 s in 10-s intervals. Plot a line that can be used to calculate the initial rate using the graph label Initial Rate.arrow_forward
arrow_back_ios
SEE MORE QUESTIONS
arrow_forward_ios
Recommended textbooks for you
- BiochemistryBiochemistryISBN:9781319114671Author:Lubert Stryer, Jeremy M. Berg, John L. Tymoczko, Gregory J. Gatto Jr.Publisher:W. H. Freeman
 Lehninger Principles of BiochemistryBiochemistryISBN:9781464126116Author:David L. Nelson, Michael M. CoxPublisher:W. H. Freeman
 Fundamentals of Biochemistry: Life at the Molecul...BiochemistryISBN:9781118918401Author:Donald Voet, Judith G. Voet, Charlotte W. PrattPublisher:WILEY
  BiochemistryBiochemistryISBN:9781305961135Author:Mary K. Campbell, Shawn O. Farrell, Owen M. McDougalPublisher:Cengage Learning
 BiochemistryBiochemistryISBN:9781305577206Author:Reginald H. Garrett, Charles M. GrishamPublisher:Cengage Learning
 Fundamentals of General, Organic, and Biological ...BiochemistryISBN:9780134015187Author:John E. McMurry, David S. Ballantine, Carl A. Hoeger, Virginia E. PetersonPublisher:PEARSON
Biochemistry
Biochemistry
ISBN:9781319114671
Author:Lubert Stryer, Jeremy M. Berg, John L. Tymoczko, Gregory J. Gatto Jr.
Publisher:W. H. Freeman
Lehninger Principles of Biochemistry
Biochemistry
ISBN:9781464126116
Author:David L. Nelson, Michael M. Cox
Publisher:W. H. Freeman
Fundamentals of Biochemistry: Life at the Molecul...
Biochemistry
ISBN:9781118918401
Author:Donald Voet, Judith G. Voet, Charlotte W. Pratt
Publisher:WILEY
Biochemistry
Biochemistry
ISBN:9781305961135
Author:Mary K. Campbell, Shawn O. Farrell, Owen M. McDougal
Publisher:Cengage Learning
Biochemistry
Biochemistry
ISBN:9781305577206
Author:Reginald H. Garrett, Charles M. Grisham
Publisher:Cengage Learning
Fundamentals of General, Organic, and Biological ...
Biochemistry
ISBN:9780134015187
Author:John E. McMurry, David S. Ballantine, Carl A. Hoeger, Virginia E. Peterson
Publisher:PEARSON