
Human Anatomy & Physiology (11th Edition)
11th Edition
ISBN: 9780134580999
Author: Elaine N. Marieb, Katja N. Hoehn
Publisher: PEARSON
expand_more
expand_more
format_list_bulleted
Related questions
Question
Plot absorption versus time using the graph label mAbs vs time(s) from 0 to 120 s in 10-s intervals. Plot a line that can be used to calculate the initial rate using the graph label Initial Rate.
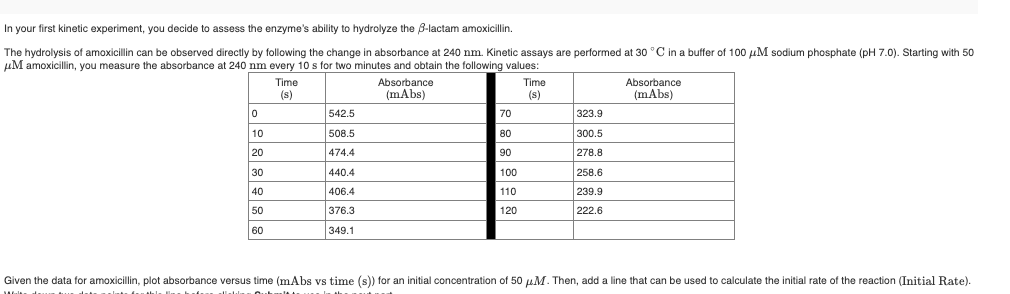

Transcribed Image Text:In this kinetic experiment, the focus is on evaluating an enzyme's ability to hydrolyze the β-lactam antibiotic, amoxicillin. The process is monitored by measuring changes in absorbance at 240 nm. The experiment is conducted at 30°C using a buffer solution with a concentration of 100 μM sodium phosphate at pH 7.0. Initially, a 50 μM solution of amoxicillin is used, and absorbance is recorded every 10 seconds over a 2-minute period.
### Collected Data
The absorbance readings at different time intervals are presented below:
| Time (s) | Absorbance (mΔAbs) | Time (s) | Absorbance (mΔAbs) |
|----------|--------------------|----------|--------------------|
| 0 | 542.5 | 70 | 323.9 |
| 10 | 508.5 | 80 | 300.5 |
| 20 | 474.4 | 90 | 278.8 |
| 30 | 440.4 | 100 | 258.6 |
| 40 | 406.4 | 110 | 239.9 |
| 50 | 376.3 | 120 | 222.6 |
| 60 | 349.1 | | |
### Instructions for Analysis
- Plot a graph of absorbance versus time using the given data.
- Identify the initial rate of reaction by drawing a line from the plotted data that best represents the data points in their initial linear phase.
This experiment demonstrates how enzymatic activity can be quantitatively analyzed through absorbance changes, illustrating the enzyme kinetics involved in hydrolyzing amoxicillin.

Transcribed Image Text:The image displays a graph of absorbance versus time, likely from a spectrophotometry experiment.
**Graph Details:**
- **Title:** The graph doesn’t have a specific title but represents absorbance data over time.
- **Y-Axis (Vertical):** The y-axis is labeled as "Absorbance (mAbs)" with values ranging from 225 to 550 milli-absorbance units.
- **X-Axis (Horizontal):** The x-axis is labeled as "time(s)" with values ranging from 0 to 120 seconds.
**Graph Description:**
- A red dashed line slopes downward, indicating a decrease in absorbance over time.
- It starts near the top-left corner, around 550 mAbs at time zero and slopes down to approximately 225 mAbs at around 90 seconds.
- Two orange points are marked on the line at approximately 10 seconds (540 mAbs) and 70 seconds (400 mAbs), possibly indicating specific data points or measurements.
This type of graph can be used to analyze the rate of reaction in a chemical experiment, demonstrating how the concentration of a substance changes over time.
Expert Solution
This question has been solved!
Explore an expertly crafted, step-by-step solution for a thorough understanding of key concepts.

This is a popular solution

Trending nowThis is a popular solution!

Step by stepSolved in 2 steps with 1 images

Knowledge Booster

Similar questions
- Compute for the dilution factor of the WBC pipet if blood is sucked up to 0.2 mark and the diluting fluid at 11 mark.arrow_forwardBelow is an oxygen-binding curve for two hemoglobin variants. 1.0 0.8 0.6 B 0.4 0.2 20 40 60 80 100 O2 pressure (torr) Determine the p50 for variant A to the nearest 5 torr (i.e., if the p50 was 12, you would write 10). Determine the fraction of the hemoglobin B bound with O2 in the lungs (pO2 = 100 torr) that delivers oxygen to the tissues (pO2 = 20 torr)? Answer to the nearest 0.05 value (for example, 0.10 or 0.15). Which hemoglobin variant (write A or B or same) delivers more oxygen to tissues? Fraction bound with O2arrow_forwardThe birt rate, b, is defined by what equations: b=r+d b= r-d b= Bt/Nt b= r/d b= Bt-Ntarrow_forward
- A new oxygen transport protein that exhibits cooperative binding has been isolated and is beingstudied in the lab. Calculate the KD value if Y = 0.76 when pO2 = 18 torr (assume n = 2.5). Howdoes this compare to the KD value for hemoglobin? Does this protein bind more or less tightly tooxygen compared to hemoglobin?arrow_forwardConsider the following set of data and answer the foarrow_forwardAn experiment was carried out to measure the reaction rate of hydrolysis of acetylcholme (substrate) with serum enzymes (Eadie, 1949). In the experiment, two experiments were conducted, namely experiment 1 without using a prostigmine inhibitor and experiment 2 using a prostigmine inhibitor at 1.5 x 10^-7 mol/l. the data obtained are: a. Is prostigmine competitive or noncompetitive inhibitor? b. determine the value of km and rmax for the two experiments, comparearrow_forward
- Penicillin is hydrolyzed and thereby rendered inactive by penicillinase, an enzyme present in some resistant bacteria. The mass of this enzyme in Staphylococcus aureus is 29.6 kd. The amount of penicillin hydrolyzed in 1 minute in 10 ml solution containing 10–9 g of purified penicillinase was measured as a function of the concentration of penicillin. Assume that the concentration of penicillin does not change during the assay. [Penicillin] µM Amount hydrolyzed (nanomoles) 1 0.11 3 0.25 5 0.34 10 0.45 30 0.58 50 0.61 a) Plot V0 versus [S] and 1/V0 1/[S]. Does penicillinase appear to obey Michaelis-Menten kinetics? b) What is the value of KM? c) What is the value of Vmax? d) What is the turnover number of penicillinase under these conditions?arrow_forwardWAs there a clear lactate threshold point?arrow_forwardThe air supply to a fermenter was turned off for a short period of time and then restarted. A value for C* of 7.3 mg/l of has been determined for the operating conditions. Use the tabulated measurements of dissolved oxygen (DO) values in the following table to estimate the oxygen uptake rate and kla in this system. Time (min) DO (mg/l) -1 3.3 Air off 3.3 1 2.4 2 1.3 3 0.3 4 0.1 0.0 Air on 0.0 7 0.3 1.0 9. 1.6 10 2.0 11 2.4 12 2.7 13 2.9 14 3.0 15 3.1 16 3.2 17 3.2arrow_forward
- The graph is of initial velocity versus substrate concentration. Estimate Vmax from the direct graph of v versus [S] using the plot. Estimate KM from the direct graph of v versus [S] using the plot, also.arrow_forwardWhen determining CFUs for a dilution of the same sample at 10-2 and 10-3 which of the following results would seem the most accurate to you? Explain why in the space below. A. 110,000 CFU/mL for 10-2; and 140,000 CFU/mL 10-3 B. 110,000 CFU/mL for 10-2; and 14,000 CFU/mL 10-3 C. 10,000 CFU/mL for 10-2; and 140,000 CFU/mL 10-3 D. none of the abovearrow_forwardCalculate the patient’s INTAKE during your 12-hour shift (7am - 7pm): (Show your computation and conversion process) 08:00am: Two pieces of toast, 2 cups of oatmeal, 12 oz orange juice 10:00am: Two 8 oz of coffee 11:00am: 24 oz of ice chips 12:00pm: IV infusion of Zosyn 50 mL, 2 mL IV push Zofran and 10 cc saline IV flush 12:30pm: house salad, 12 oz soda, three 12 oz popsicles 2:00pm: One pack of red blood cells (250mL) 3:00pm: 2 mL Morphine and 10 cc saline flush IV 5:15pm: 10 cc saline flush IV 4:00pm-7:00pm: Normal Saline IV 150 cc/hrarrow_forward
arrow_back_ios
SEE MORE QUESTIONS
arrow_forward_ios
Recommended textbooks for you
- Human Anatomy & Physiology (11th Edition)BiologyISBN:9780134580999Author:Elaine N. Marieb, Katja N. HoehnPublisher:PEARSON
 Biology 2eBiologyISBN:9781947172517Author:Matthew Douglas, Jung Choi, Mary Ann ClarkPublisher:OpenStax
 Anatomy & PhysiologyBiologyISBN:9781259398629Author:McKinley, Michael P., O'loughlin, Valerie Dean, Bidle, Theresa StouterPublisher:Mcgraw Hill Education,
  Molecular Biology of the Cell (Sixth Edition)BiologyISBN:9780815344322Author:Bruce Alberts, Alexander D. Johnson, Julian Lewis, David Morgan, Martin Raff, Keith Roberts, Peter WalterPublisher:W. W. Norton & Company
 Laboratory Manual For Human Anatomy & PhysiologyBiologyISBN:9781260159363Author:Martin, Terry R., Prentice-craver, CynthiaPublisher:McGraw-Hill Publishing Co.
 Inquiry Into Life (16th Edition)BiologyISBN:9781260231700Author:Sylvia S. Mader, Michael WindelspechtPublisher:McGraw Hill Education
Human Anatomy & Physiology (11th Edition)
Biology
ISBN:9780134580999
Author:Elaine N. Marieb, Katja N. Hoehn
Publisher:PEARSON
Biology 2e
Biology
ISBN:9781947172517
Author:Matthew Douglas, Jung Choi, Mary Ann Clark
Publisher:OpenStax
Anatomy & Physiology
Biology
ISBN:9781259398629
Author:McKinley, Michael P., O'loughlin, Valerie Dean, Bidle, Theresa Stouter
Publisher:Mcgraw Hill Education,
Molecular Biology of the Cell (Sixth Edition)
Biology
ISBN:9780815344322
Author:Bruce Alberts, Alexander D. Johnson, Julian Lewis, David Morgan, Martin Raff, Keith Roberts, Peter Walter
Publisher:W. W. Norton & Company
Laboratory Manual For Human Anatomy & Physiology
Biology
ISBN:9781260159363
Author:Martin, Terry R., Prentice-craver, Cynthia
Publisher:McGraw-Hill Publishing Co.
Inquiry Into Life (16th Edition)
Biology
ISBN:9781260231700
Author:Sylvia S. Mader, Michael Windelspecht
Publisher:McGraw Hill Education