
MATLAB: An Introduction with Applications
6th Edition
ISBN: 9781119256830
Author: Amos Gilat
Publisher: John Wiley & Sons Inc
expand_more
expand_more
format_list_bulleted
Related questions
Question

Transcribed Image Text:10.2.22
Question Help
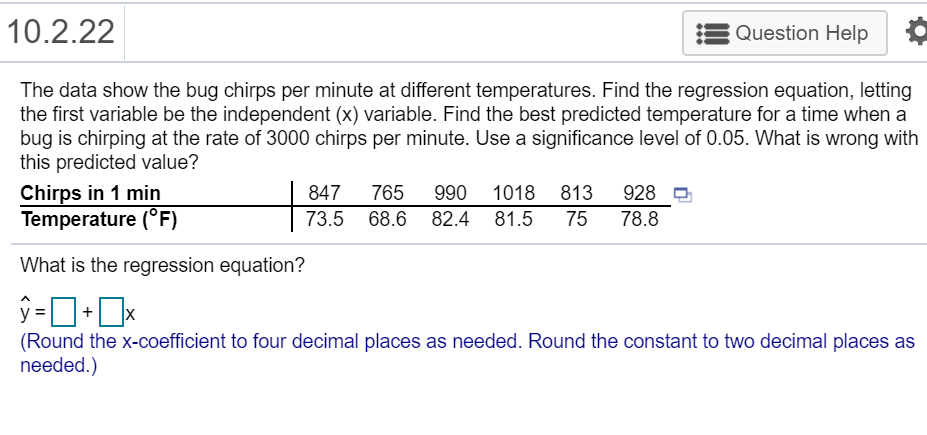
The data show the bug chirps per minute at different temperatures. Find the regression equation, letting
the first variable be the independent (x) variable. Find the best predicted temperature for a time when a
bug is chirping at the rate of 3000 chirps per minute. Use a significance level of 0.05. What is wrong with
this predicted value?
Chirps in 1 min
Temperature (°F)
847
765
990
1018 813
928
73.5 68.6 82.4
81.5
75
78.8
What is the regression equation?
ŷ-D•Ox
%3D
(Round the x-coefficient to four decimal places as needed. Round the constant to two decimal places as
needed.)
Expert Solution
This question has been solved!
Explore an expertly crafted, step-by-step solution for a thorough understanding of key concepts.

This is a popular solution

Trending nowThis is a popular solution!

Step by stepSolved in 2 steps with 3 images

Knowledge Booster

Similar questions
- 49arrow_forwardI’m taking a statistics and probability class. Please get this correct because I want to learn. I have gotten wrong answers on here beforearrow_forwardFind the regression equation, letting overhead width be the predictor (x) variable. Find the best predicted weight of a seal if the overhead width measured from a photograph is 2.3 cm. Can the prediction be correct? What is wrong with predicting the weight in this case? Use a significance level of 0.05. Overhead Width (cm) Weight (kg) 7.8 175 7.3 9.5 274 7.4 156 9.9 294 9.2 183 256 Click the icon to view the critical values of the Pearson correlation coefficient r. ..... The regression equation is y =+x. (Round to one decimal place as needed.)arrow_forward
- 13/arrow_forwardplease see attached - thank you in advancearrow_forwardFind the regression equation, letting overhead width be the predictor (x) variable. Find the best predicted weight of a seal if the overhead width measured from a photograph is 2.5 cm. Can the prediction be correct? What is wrong with predicting the weight in this case? Use a significance level of 0.05. Overhead Width (cm) 7.6 7.4 9.8 8.8 9.3 7.3 Weight (kg) 142 163 256 188 231 156 The regression equation is y= + x. (Round to one decimal place as needed.) The best predicted weight for an overhead width of 2.5 cm is kg? (Round to one decimal place as needed.) Can the prediction be correct? What is wrong with predicting the weight in this case? A. The prediction cannot be correct because a negative weight does not make sense. The width in this case is beyond the scope of the available sample data. B. The prediction cannot be correct because a negative weight does not make sense and because there is…arrow_forward
- Write the linear model to test the hypothesis that there is no treatment effect. Clearly describe each term in the model, and the range of the subscripts. Write the null hypothesis that you are testing. Call: lm(formula = score ~ list, data = hearing) Residuals: Min 1Q Median 3Q Max -14.7500 -5.5833 -0.2083 6.3333 16.4167 Coefficients: Estimate Std. Error t value Pr(>|t|) (Intercept) 32.750 1.612 20.315 < 2e-16 *** listList2 -3.083 2.280 -1.352 0.17955 listList3 -7.500 2.280 -3.290 0.00142 ** listList4 -7.167 2.280 -3.144 0.00225 ** --- Signif. codes: 0 ‘***’ 0.001 ‘**’ 0.01 ‘*’ 0.05 ‘.’ 0.1 ‘ ’ 1 Residual standard error: 7.898 on 92 degrees of freedom Multiple R-squared: 0.1382, Adjusted R-squared: 0.1101 F-statistic: 4.919 on 3 and 92 DF, p-value: 0.00325arrow_forwardThe data show the bug chirps per minute at different temperatures. Find the regression equation, letting the first variable be the independent (x) variable. Find the best predicted temperature for a time when a bug is chirping at the rate of 3000 chirps per minute. Use a significance level of 0.05. What is wrong with this predicted value? Chirps in 1 min 1118 796 1161 918 1103 1219 Temperature (F) 82 72.2 92.2 73 87.5 94.4arrow_forwardUsing the data in the Excel spreadsheet "auto.xlsx", estimate a regression to answer the following question. How much does a 1 inch increase in LENGTH corresponds to a _________________ dollars increase in PRICE. Use negative values if it results in a decreased price. Round your answers to two decimals.arrow_forward
arrow_back_ios
arrow_forward_ios
Recommended textbooks for you
- MATLAB: An Introduction with ApplicationsStatisticsISBN:9781119256830Author:Amos GilatPublisher:John Wiley & Sons Inc
 Probability and Statistics for Engineering and th...StatisticsISBN:9781305251809Author:Jay L. DevorePublisher:Cengage Learning
 Statistics for The Behavioral Sciences (MindTap C...StatisticsISBN:9781305504912Author:Frederick J Gravetter, Larry B. WallnauPublisher:Cengage Learning
  Elementary Statistics: Picturing the World (7th E...StatisticsISBN:9780134683416Author:Ron Larson, Betsy FarberPublisher:PEARSON
 The Basic Practice of StatisticsStatisticsISBN:9781319042578Author:David S. Moore, William I. Notz, Michael A. FlignerPublisher:W. H. Freeman
 Introduction to the Practice of StatisticsStatisticsISBN:9781319013387Author:David S. Moore, George P. McCabe, Bruce A. CraigPublisher:W. H. Freeman
MATLAB: An Introduction with Applications
Statistics
ISBN:9781119256830
Author:Amos Gilat
Publisher:John Wiley & Sons Inc
Probability and Statistics for Engineering and th...
Statistics
ISBN:9781305251809
Author:Jay L. Devore
Publisher:Cengage Learning
Statistics for The Behavioral Sciences (MindTap C...
Statistics
ISBN:9781305504912
Author:Frederick J Gravetter, Larry B. Wallnau
Publisher:Cengage Learning
Elementary Statistics: Picturing the World (7th E...
Statistics
ISBN:9780134683416
Author:Ron Larson, Betsy Farber
Publisher:PEARSON
The Basic Practice of Statistics
Statistics
ISBN:9781319042578
Author:David S. Moore, William I. Notz, Michael A. Fligner
Publisher:W. H. Freeman
Introduction to the Practice of Statistics
Statistics
ISBN:9781319013387
Author:David S. Moore, George P. McCabe, Bruce A. Craig
Publisher:W. H. Freeman