
MATLAB: An Introduction with Applications
6th Edition
ISBN: 9781119256830
Author: Amos Gilat
Publisher: John Wiley & Sons Inc
expand_more
expand_more
format_list_bulleted
Related questions
Question
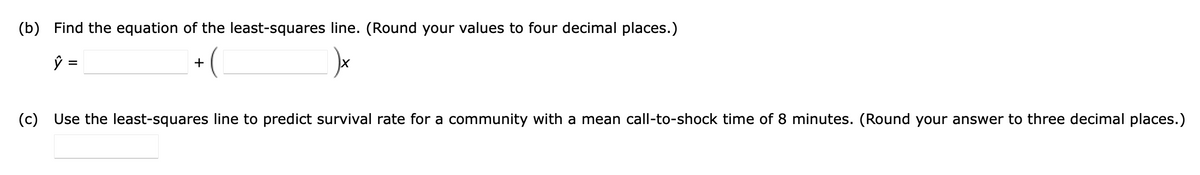

Transcribed Image Text:(b) Find the equation of the least-squares line. (Round your values to four decimal places.)
\(\hat{y} = \underline{\hspace{2cm}} + \left(\underline{\hspace{2cm}}\right)x\)
(c) Use the least-squares line to predict survival rate for a community with a mean call-to-shock time of 8 minutes. (Round your answer to three decimal places.)
\(\underline{\hspace{2cm}}\)

Transcribed Image Text:**Study on Cardiac Arrest and Defibrillator Shock Timing**
Studies indicate that individuals who experience sudden cardiac arrest have improved survival chances if a defibrillator shock is rapidly administered. The question explored here is: How is the survival rate influenced by the duration between the occurrence of cardiac arrest and the administration of the defibrillator shock?
The data provided examines the relationship between the survival rate (y, in percent) and the mean call-to-shock time (x, in minutes) for both a cardiac rehabilitation center (where arrests occur while victims are hospitalized, leading to shorter call-to-shock times) and four different communities of varying sizes.
**Data Table:**
| **Mean call-to-shock time, x (minutes)** | 2 | 6 | 7 | 9 | 12 |
|------------------------------------------|----|----|----|----|----|
| **Survival rate, y (percent)** | 91 | 46 | 32 | 6 | 4 |
**Explanation:**
- The table illustrates that as the mean call-to-shock time increases, the survival rate significantly decreases. For instance, with a call-to-shock time of 2 minutes, the survival rate is 91%, but it drops to 4% with a 12-minute delay.
- This data highlights the critical importance of minimizing the time between cardiac arrest occurrence and defibrillator intervention to improve survival outcomes.
Expert Solution
This question has been solved!
Explore an expertly crafted, step-by-step solution for a thorough understanding of key concepts.

This is a popular solution

Trending nowThis is a popular solution!

Step by stepSolved in 3 steps with 2 images

Knowledge Booster

Similar questions
- An bus station has determined that the relationship between the number of passengers on a bus and the total weight of luggage stored in the baggage compartment can be estimated by the least squares regression equation y=115+24xy=115+24x. Predict the weight of luggage for a flight with 60 passengers. Answer: pounds Speakarrow_forwardPlzzz explainarrow_forwardHelp please!arrow_forward
- Answer the 2 questions from the page with the question starting with "Give a practical interpretation..."arrow_forwardKindly solve the sub part (c) , (d) and (e) .... don't solve the part (a) and (b)arrow_forwardThe sum of the squared residuals for the line contalning the points (- 2, - 2) and (2,5) is 0.875 (d) Compute the sum of the squared residuals of the given data set for the least-squares regression line found in part (a). The sum of the squared residuals for the least-squares regression line isarrow_forward
- A medical study on the systolic blood pressure readings (top number) on men over 40 years old results in the data below. The x-value is the number of years past 40 years old and the y-value is the systolic blood pressure reading. x y 8 63 11 77 14 86 17 90 20 140 Find the least squares regression line modeling this data. What is the slope of the regression line? Round your answer to three decimal places. Provide your answer below:arrow_forwardBased on data taken from airline fares and distances One of the flights was 350 miles and its residual was - flown, it is determined that the equation of the least- 105.00. What was the fare for this flight? squares regression line is ŷ = 102.50+ 0.65x, where y is the predicted fare and x is the distance, in miles. $102.50 $435.00 $225.00 $330.00arrow_forwardus the least-squares regression method to solve for accidents in May.arrow_forward
- Please reply fast .. I will give you upvotearrow_forwardInstructions: Use excel for your solution then paste in word file. Indicate proper tables and solution. Thank you tutors. Please answwer this ASAP. Thank you ❤️arrow_forwardThe data show the chest size and weight of several bears. Find the regression equation, letting chest size be the independent (x) variable. Then find the best predicted weight of a bear with a chest size of 58 inches. Is the result close to the actual weight of 572 pounds? Use a significance level of 0.05. Chest size (inches) 46 57 53 41 40 40 Weight (pounds) 384 580 542 358 306 320 LOADING... Click the icon to view the critical values of the Pearson correlation coefficient r. What is the regression equation? y=nothing+nothingx (Round to one decimal place as needed.)arrow_forward
arrow_back_ios
SEE MORE QUESTIONS
arrow_forward_ios
Recommended textbooks for you
- MATLAB: An Introduction with ApplicationsStatisticsISBN:9781119256830Author:Amos GilatPublisher:John Wiley & Sons Inc
 Probability and Statistics for Engineering and th...StatisticsISBN:9781305251809Author:Jay L. DevorePublisher:Cengage Learning
 Statistics for The Behavioral Sciences (MindTap C...StatisticsISBN:9781305504912Author:Frederick J Gravetter, Larry B. WallnauPublisher:Cengage Learning
  Elementary Statistics: Picturing the World (7th E...StatisticsISBN:9780134683416Author:Ron Larson, Betsy FarberPublisher:PEARSON
 The Basic Practice of StatisticsStatisticsISBN:9781319042578Author:David S. Moore, William I. Notz, Michael A. FlignerPublisher:W. H. Freeman
 Introduction to the Practice of StatisticsStatisticsISBN:9781319013387Author:David S. Moore, George P. McCabe, Bruce A. CraigPublisher:W. H. Freeman
MATLAB: An Introduction with Applications
Statistics
ISBN:9781119256830
Author:Amos Gilat
Publisher:John Wiley & Sons Inc
Probability and Statistics for Engineering and th...
Statistics
ISBN:9781305251809
Author:Jay L. Devore
Publisher:Cengage Learning
Statistics for The Behavioral Sciences (MindTap C...
Statistics
ISBN:9781305504912
Author:Frederick J Gravetter, Larry B. Wallnau
Publisher:Cengage Learning
Elementary Statistics: Picturing the World (7th E...
Statistics
ISBN:9780134683416
Author:Ron Larson, Betsy Farber
Publisher:PEARSON
The Basic Practice of Statistics
Statistics
ISBN:9781319042578
Author:David S. Moore, William I. Notz, Michael A. Fligner
Publisher:W. H. Freeman
Introduction to the Practice of Statistics
Statistics
ISBN:9781319013387
Author:David S. Moore, George P. McCabe, Bruce A. Craig
Publisher:W. H. Freeman