
MATLAB: An Introduction with Applications
6th Edition
ISBN: 9781119256830
Author: Amos Gilat
Publisher: John Wiley & Sons Inc
expand_more
expand_more
format_list_bulleted
Related questions
Concept explainers
Question
Please answer all sections
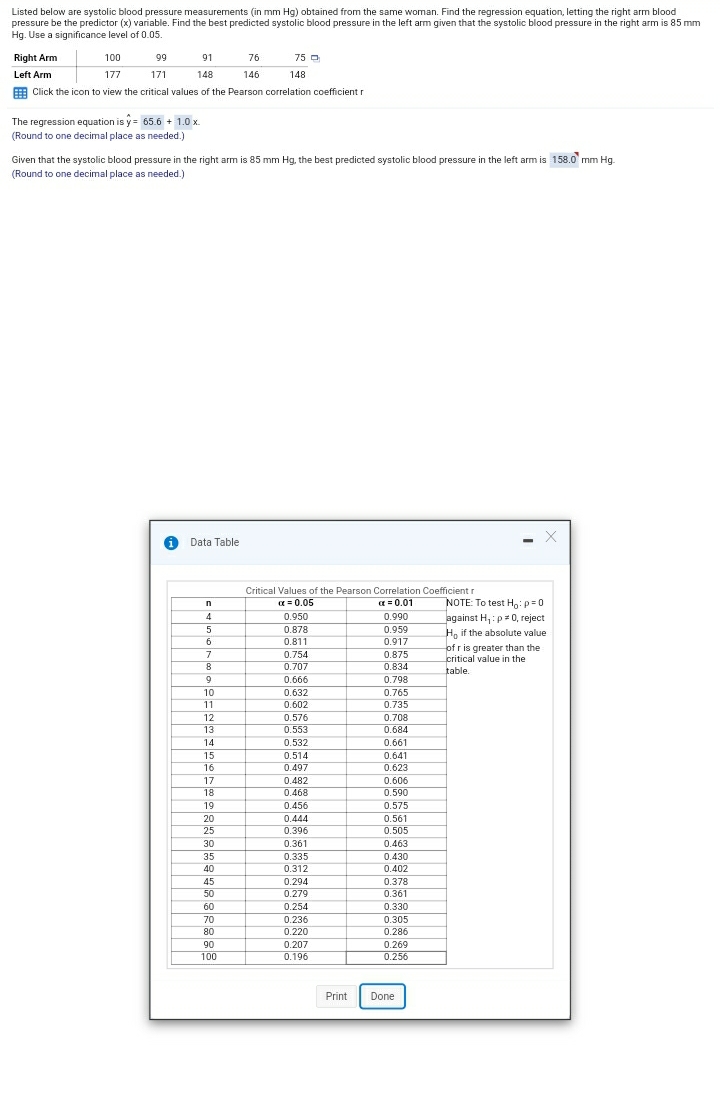

Transcribed Image Text:Listed below are systolic blood pressure measurements (in mm Hg) obtained from the same woman. Find the regression equation, letting the right arm blood
pressure be the predictor (x) variable. Find the best predicted systolic blood pressure in the left arm given that the systolic blood pressure in the right arm is 85 mm
Hg. Use a significance level of 0.05.
Right Arm
100
99
91
76
75 O
Left Arm
177
171
148
146
148
E Click the icon to view the critical values of the Pearson correlation coefficient r
The regression equation is y= 65.6 + 1.0 x.
.
(Round to one decimal place as needed.)
Given that the systolic blood pressure in the right arm is 85 mm Hg, the best predicted systolic blood pressure in the left arm is 158.0 mm Hg.
(Round to one decimal place as needed.)
O Data Table
Critical Values of the Pearson Correlation Coefficient r
a = 0.05
a = 0.01
NOTE: To test H,: p=0
n
0.950
against H,:p 0, reject
H, if the absolute value
of r is greater than the
0.990
5
0.878
0.959
0.811
0.917
0.754
0.707
7
0.875
0.834
critical value in the
8
table.
6.
0.666
0.798
0.632
0.602
10
0.765
11
0.735
12
0.576
0.708
0.684
13
0.553
14
0.532
0.661
0.514
0.497
0.641
0.623
15
16
0.482
0.468
17
0.606
18
0.590
0.575
0.561
0.505
19
0.456
20
0.444
0.396
25
0.361
0.335
30
0.463
35
0.430
40
0.312
0.402
45
50
0.294
0.279
0.378
0.361
60
0.254
0.330
70
0.236
0.305
80
0.220
0.286
0.269
0.256
90
0.207
100
0.196
Print
Done
Expert Solution
This question has been solved!
Explore an expertly crafted, step-by-step solution for a thorough understanding of key concepts.

This is a popular solution

Trending nowThis is a popular solution!

Step by stepSolved in 2 steps with 5 images

Knowledge Booster


Learn more about
Need a deep-dive on the concept behind this application? Look no further. Learn more about this topic, statistics and related others by exploring similar questions and additional content below.Similar questions
arrow_back_ios
arrow_forward_ios
Recommended textbooks for you
- MATLAB: An Introduction with ApplicationsStatisticsISBN:9781119256830Author:Amos GilatPublisher:John Wiley & Sons Inc
 Probability and Statistics for Engineering and th...StatisticsISBN:9781305251809Author:Jay L. DevorePublisher:Cengage Learning
 Statistics for The Behavioral Sciences (MindTap C...StatisticsISBN:9781305504912Author:Frederick J Gravetter, Larry B. WallnauPublisher:Cengage Learning
  Elementary Statistics: Picturing the World (7th E...StatisticsISBN:9780134683416Author:Ron Larson, Betsy FarberPublisher:PEARSON
 The Basic Practice of StatisticsStatisticsISBN:9781319042578Author:David S. Moore, William I. Notz, Michael A. FlignerPublisher:W. H. Freeman
 Introduction to the Practice of StatisticsStatisticsISBN:9781319013387Author:David S. Moore, George P. McCabe, Bruce A. CraigPublisher:W. H. Freeman
MATLAB: An Introduction with Applications
Statistics
ISBN:9781119256830
Author:Amos Gilat
Publisher:John Wiley & Sons Inc
Probability and Statistics for Engineering and th...
Statistics
ISBN:9781305251809
Author:Jay L. Devore
Publisher:Cengage Learning
Statistics for The Behavioral Sciences (MindTap C...
Statistics
ISBN:9781305504912
Author:Frederick J Gravetter, Larry B. Wallnau
Publisher:Cengage Learning
Elementary Statistics: Picturing the World (7th E...
Statistics
ISBN:9780134683416
Author:Ron Larson, Betsy Farber
Publisher:PEARSON
The Basic Practice of Statistics
Statistics
ISBN:9781319042578
Author:David S. Moore, William I. Notz, Michael A. Fligner
Publisher:W. H. Freeman
Introduction to the Practice of Statistics
Statistics
ISBN:9781319013387
Author:David S. Moore, George P. McCabe, Bruce A. Craig
Publisher:W. H. Freeman