
Excel Applications for Accounting Principles
4th Edition
ISBN: 9781111581565
Author: Gaylord N. Smith
Publisher: Cengage Learning
expand_more
expand_more
format_list_bulleted
Related questions
Question
I need do fast typing clear urjent no chatgpt used i will give 5 upvotes pls full explain with diagram
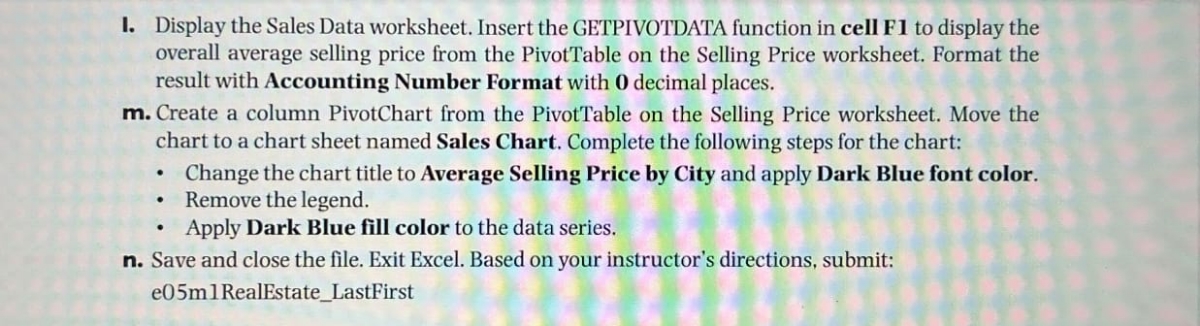

Transcribed Image Text:1. Display the Sales Data worksheet. Insert the GETPIVOTDATA function in cell F1 to display the
overall average selling price from the PivotTable on the Selling Price worksheet. Format the
result with Accounting Number Format with O decimal places.
m. Create a column PivotChart from the PivotTable on the Selling Price worksheet. Move the
chart to a chart sheet named Sales Chart. Complete the following steps for the chart:
Change the chart title to Average Selling Price by City and apply Dark Blue font color.
Remove the legend.
Apply Dark Blue fill color to the data series.
n. Save and close the file. Exit Excel. Based on your instructor's directions, submit:
e05m1RealEstate_LastFirst
Expert Solution
This question has been solved!
Explore an expertly crafted, step-by-step solution for a thorough understanding of key concepts.

Step by stepSolved in 2 steps

Knowledge Booster

Similar questions
- (a) Use Excel to make a scatter plot of the following retail store sales data, placing Coupon on the X-axis and Revenue on the Y-axis. Add titles and modify the default colors, fonts, etc., as you judge appropriate to make the scatter plot effective. (b) Describe the relationship (if any) between X and Y. Weak? Strong? Negative? Positive? Linear? Nonlinear?arrow_forwardThe image below shows the Sales History worksheet. The following HLOOKUP function was entered into the Base Data worksheet which is in the same workbook as the Sales History worksheet: =HLOOKUP(A7,Sales History'!$A$2:$E$6,2,FALSE) The word North is entered into cell A7 on the Base Data worksheet. What will be the output of this function? 1 2 3 4 5 6 7 A 4% 5% 2020 2019 2018 2017 с D Annual Sales Growth by Region North South West East North #REF! error code -2% B 5% 4% -2% 1% -5% -4% -1% -3% 3% 2% -7% -6% E 0% -9% -8% -10% Farrow_forwardYou need to create a chart that displays the volume of transactions for each customer type. Which type of graph or chart is commonly used to compare data across categories? Spatial Bar chart Scatter plot Line 马arrow_forward
- Select the letter of the item below that best matches the definitions that follow. a. Balance Sheet Standard report. b. To date c. Summary Balance Sheet report d. QuickZoom e. Transactions by Account report f. % of Column g. Memorizing a report h. Divided by 1000 1. ________ When selected in the Modify Report window, this check box requires QuickBooks Accountant to add a column representing the percentage of each item compared to total assets. 2. ________ When selected in the Modify Report window, this check box requires QuickBooks Accountant to round amounts to the nearest whole dollar. 3. ________ The start of the reporting period. 4. ________ A financial statement reporting in detail the assets, liabilities, and equities of a business as of a certain date. 5. ________ A process by which modified reports are saved for later use. 6. ________ When selected in the Modify Report window, this check box requires QuickBooks Accountant to report amounts in thousands. 7. ________ The end…arrow_forwardRaymond Autobody Shop has the following accounts: A (Click the icon to view the accounts.) Create a chart of accounts for Raymond Autobody Shop using the standard numbering system. Each account is separated by a factor of 10. For example, the first asset account will be 100 and the next asset account will 110. (Use the first available line under each section, Asset, Liabilities, etc., when selecting the accounts. If a box is not used, leave the box empty; do not select any labels.) Balance Sheet Accounts - X More info Assets Liabilities Equity Accounts Payable Service Revenue Cash Equipment Utilities Expense Common Stock Automotive Supplies Advertising Expense Income Statement Accounts Dividends Unearned Revenue (Part of Equity) Retained Earnings Revenues Expenses Print Donearrow_forwardUse the graph in order to answer the following question Name three data sources that would need to access the products and inventoryarrow_forward
- Answe these questions in relation to accounting packages systemsarrow_forwardWhich of the following are common use cases for VLOOKUP? (Check all that apply) Check All That Apply Finding a customer's name based on their ID Calculating the total sales of a specific product Looking up a product's price in a price list Retrieving an employee's phone number from a database Returning values from a different sheet in the same workbook.arrow_forwardA. What document is used to create the Sales Order in the Revenue Cycle and where does itcome from?B. Who creates the Sales order?C. Who gets copies of the Sales Order?In the space below, please answer parts A, B, and C.arrow_forward
- Given the following business rules, construct an ER diagram so each rule is captured for the database. Presume each rule is to be treated individually. Construct an ER diagram for each rule.a. A retail sales company prepares sales orders for its customers’ purchases. A customer can make many purchases, but a sales order is written for a single customer.b. A retail sales company orders inventory using a purchase order. An inventory item may be ordered many times, and a purchase order may be created for more than one inventory item.c. A company that sells antique cars prepares a sales order for each car sold. The inventory for this company consists of unique automobiles, and only one of these automobiles may be listed on a sales order.d. A grocery store identifies returning customers via a plastic card that the clerk scans at the time of each purchase. The purpose of this card is to track inventory and to maintain a database of customers and their purchases. Obviously, a customer may…arrow_forwardFor each of the following items, indicate whether a sequential, block, group, alphabetic, or mnemonic code would be most appropriate (you may list multiple methods; give an example and explain why each method is appropriate):a. state codesb. check numberc. chart of accountsd. inventory item number e. -bin number (inventory warehouse location) f. sales order number g. vendor code h. invoice number i. customer numberarrow_forwardCustom fields can be created ____________________.Select all that apply. Select one or more: A. on the Advanced tab of Account and Settings B. on the Expenses tab of Account and Settings C. on the Sales tab of Account and Settings D. on the Company tab of Account and Settingsarrow_forward
arrow_back_ios
SEE MORE QUESTIONS
arrow_forward_ios
Recommended textbooks for you
- Excel Applications for Accounting PrinciplesAccountingISBN:9781111581565Author:Gaylord N. SmithPublisher:Cengage Learning
 College Accounting, Chapters 1-27AccountingISBN:9781337794756Author:HEINTZ, James A.Publisher:Cengage Learning,
 Principles of Accounting Volume 1AccountingISBN:9781947172685Author:OpenStaxPublisher:OpenStax College
Excel Applications for Accounting Principles
Accounting
ISBN:9781111581565
Author:Gaylord N. Smith
Publisher:Cengage Learning
College Accounting, Chapters 1-27
Accounting
ISBN:9781337794756
Author:HEINTZ, James A.
Publisher:Cengage Learning,
Principles of Accounting Volume 1
Accounting
ISBN:9781947172685
Author:OpenStax
Publisher:OpenStax College