
Videos
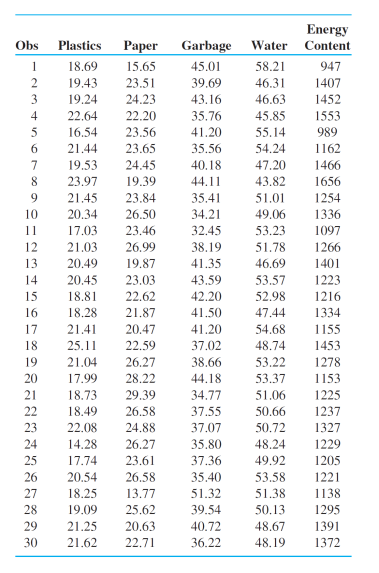
Efficient design of certain types of municipal waste incinerators requires that information about energy content of the waste be available. The authors of the article “Modeling the Energy Content of Municipal Solid Waste Using Multiple Regression Analysis” (J. of the Air and Waste Mgmnt. Assoc., 1996: 650–656) kindly provided us with the accompanying data on y = energy content (kcal/kg), the three physical composition variables x1 = % plastics by weight, x2 = % paper by weight, and x3 = % garbage by weight, and the proximate analysis variable x4 = % moisture by weight for waste specimens obtained from a certain region.
Using Minitab to fit a multiple regression model with the four aforementioned variables as predictors of energy content resulted in the following output:
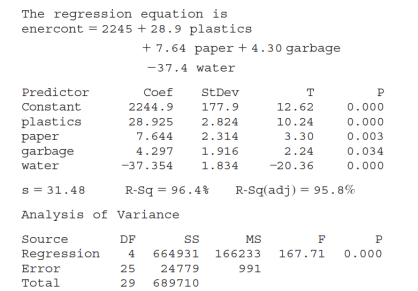
a. Interpret the values of the estimated regression coefficients
b. State and test the appropriate hypotheses to decide whether the model fit to the data specifies a useful linear relationship between energy content and at least one of the four predictors.
c. Given that % plastics, % paper, and % water remain in the model, does % garbage provide useful information about energy content? State and test the appropriate hypotheses using a significance level of .05.
d. Use the fact that
e. Use the information given in part (d) to predict energy content for a waste sample having the specified characteristics, in a way that conveys information about precision and reliability.
Want to see the full answer?
Check out a sample textbook solution
Chapter 13 Solutions
Probability and Statistics for Engineering and the Sciences


- Find the equation of the regression line for the following data set. x 1 2 3 y 0 3 4arrow_forwardWrinkle recovery angle and tensile strength are the two most important characteristics for evaluating the performance of crosslinked cotton fabric. An increase in the degree of crosslinking, as determined by ester carboxyl band absorbance, improves the wrinkle resistance of the fabric (at the expense of reducing mechanical strength). The accompanying data on x = absorbance and y = wrinkle resistance angle was read from a graph in the paper "Predicting the Performance of Durable Press Finished Cotton Fabric with Infrared Spectroscopy".t 半 0.115 0.126 0.183 0.246 0.282 0.344 0.355 0.452 0.491 0.554 0.651 334 342 355 363 365 372 381 392 400 412 420 Here is regression output from Minitab: Predictor Coef SE Coef P Constant 321.878 2.483 129.64 0.000 absorb 156.711 6.464 24.24 0.000 S = 3.60498 R-Sq = 98.5% R-Są (adj) - 98.3% SOURCE DF MS F P Regression 1 7639.0 7639.0 587.81 0.000 Residual Error 9 117.0 13.0 Total 10 7756.0 (a) Does the simple linear regression model appear to be…arrow_forwardA statistical program is recommended.A highway department is studying the relationship between traffic flow and speed. The following model has been hypothesized:y = 0 + 1x + wherey traffic flow in vehicles per hourx = vehicle speed in miles per hour.The following data were collected during rush hour for six highways leading out of the city.Traffic Flow(y)Vehicle Speed(x )1,247351,320401,218301, 327451,341501, 11325(a) Develop an estimated regression equation for the data. (Round bo to one decimal place and b1 to two decimal places.) =arrow_forward
- The article "Earthmoving Productivity Estimation Using Linear Regression Techniques" (S. Smith, Journal of Construction Engineering and Management, 1999:133–141) presents the following linear model to predict earth-moving productivity (in m3 moved per hour): Productivity = - 297.877 + 84.787x, + 36.806x, + 151.680x, – 0.081x, – 110.517x5 - 0.267.x, – 0.016x,x, +0.107.x,x5 + 0.0009448x,x, – 0.244x;x, where X1 = number of trucks X2 = number of buckets per load X3 = bucket volume, in m³ X4 = haul length, in m X5 = match factor (ratio of hauling capacity to loading capacity) X6 = truck travel time, in s If the bucket volume increases by 1 m², while other independent variables are unchanged, can you determine the change in the predicted productivity? If so, determine it. If not, state what other information you would need to determine it. b. If the haul length increases by 1 m, can you determine the change in the predicted productivity? If so, determine it. If not, state what other…arrow_forwarda) We conduct a regression of size on hhinc, owner, hhsize, hhsize2,and hhsize3. We do not include the constant. The regression output is reported in Table 3. Would you conclude that the home size increases with the household size? Interpret the sign and magnitude of the estimated coefficients of hhsize1, hhsize2, and hhsize3.arrow_forwardWrinkle recovery angle and tensile strength are the two most important characteristics for evaluating the performance of crosslinked cotton fabric. An increase in the degree of crosslinking, as determined by ester carboxyl band absorbance, improves the wrinkle resistance of the fabric (at the expense of reducing mechanical strength). The accompanying data on x = absorbance and y = wrinkle resistance angle was read from a graph in the paper "Predicting the Performance of Durable Press Finished Cotton Fabric with Infrared Spectroscopy".t x 0.115 0.126 0.183 0.246 0.282 0.344 0.355 0.452 0.491 0.554 0.651 y 334 342 355 363 365 372 381 400 392 412 420 Here is regression output from Minitab: Predictor Constant absorb S = 3.60498 Coef 321.878 156.711 SOURCE Regression Residual Error Total R-Sq= 98.5% DF SE Coef 2.483 6.464 1 9 10 SS 7639.0 117.0 7756..0 T 129.64 24.24 P 0.000 0.000. R-Sq (adj) 98.3% MS 7639.0 13.0 F 587.81 (a) Does the simple linear regression model appear to be appropriate?…arrow_forward
- Pls. help me in my stat about CORRELATION ANALYSIS, SIMPLE REGRESSION ANALYSIS AND PATH ANALYSIS IN Rarrow_forwardRetail price data for n = 60 hard disk drives were recently reported in a computer magazine. Three variables were recorded for each hard disk drive: y = Retail PRICE (measured in dollars) X1 = Microprocessor SPEED (measured in megahertz) (Values in sample range from 10 to 40) x 2 = CHIP size (measured in computer processing units) (Values in sample range from 286 to 486) A first-order regression model. was fit to the data. Part of the printout follows: Parameter Estimates T FOR 0 ERROR PARAMETER = 0 PROB>ITI PARAMETER STANDARD VARIABLE DF ESTIMATE INTERCEPT 1 -373.526392 1258.1243396 -0.297 0.7676 SPEED 1 104.838940 22.36298195 4 688 0.0001 сHP 1 3.571850 3.89422935 0.917 0.3629 Identify and interpret the estimate of B2-arrow_forwardFind the new data point (x,y) in which x=2 from the data points (1.3) and (4.12)arrow_forward
- Question 3. a) A Biologist is comparing intervals (m seconds) between the matting calls of a certain species of tree frog and the surrounding temperature (t degree Celsius). The following results were obtained: t 8 13 14 15 15 20 25 30 6.5 4.5 4 3 2 1 1. Fit the regression line in the form m = a + bt. 2. Interpret your estimates. 3. Use your regression line interval between matting calls when the surrounding temperature is 10 degrees. (6 marks) estimate the timearrow_forward13) Use computer software to find the multiple regression equation. Can the equation be used for prediction? An anti-smoking group used data in the table to relate the carbon monoxide( CO) of various brands of cigarettes to their tar and nicotine (NIC) content. 13). CO TAR NIC 15 1.2 16 15 1.2 16 17 1.0 16 6. 0.8 1 0.1 1 8. 0.8 8. 10 0.8 10 17 1.0 16 15 1.2 15 11 0.7 9. 18 1.4 18 16 1.0 15 10 0.8 9. 0.5 18 1.1 16 A) CO = 1.37 + 5.50TAR – 1.38NIC; Yes, because the P-value is high. B) CÓ = 1.37 - 5.53TAR + 1.33NIC; Yes, because the R2 is high. C) CO = 1.25 + 1.55TAR – 5.79NIC; Yes, because the P-value is too low. D) CO = 1.3 + 5.5TAR - 1.3NIC; Yes, because the adjusted R2 is high. %3Darrow_forwardAa Febru The body mass index (BMI) of a person is defined to be the person's body mass divided by the square of the person's height. The article "Influences of Parameter Uncertainties within the ICRP 66 Respiratory Tract Model: Particle Deposition" (W. Bolch, E. Farfan, et al., Health Physics, 2001:378-394) states that body mass index (in kg/m2) in men aged 25-34 is lognormally distributed with parameters u = 3.215 and o = 0.157. a.Find the mean and standard deviation BMI for men aged 25-34. b.Find the standard deviation of BMI for men aged 25-34. c.Find the median BMI for men aged 25-34. d.What proportion of men aged 25-34 have a BMI less than 20? e.Find the 80th percentile of BMI for men agėd 25 -34. 04... Rext 田arrow_forward
 Algebra & Trigonometry with Analytic GeometryAlgebraISBN:9781133382119Author:SwokowskiPublisher:Cengage
 Calculus For The Life SciencesCalculusISBN:9780321964038Author:GREENWELL, Raymond N., RITCHEY, Nathan P., Lial, Margaret L.Publisher:Pearson Addison Wesley,
 Functions and Change: A Modeling Approach to Coll...AlgebraISBN:9781337111348Author:Bruce Crauder, Benny Evans, Alan NoellPublisher:Cengage Learning