
Probability and Statistics for Engineering and the Sciences
9th Edition
ISBN: 9781305251809
Author: Jay L. Devore
Publisher: Cengage Learning
expand_more
expand_more
format_list_bulleted
Concept explainers
Videos
Textbook Question
Chapter 13.4, Problem 44E
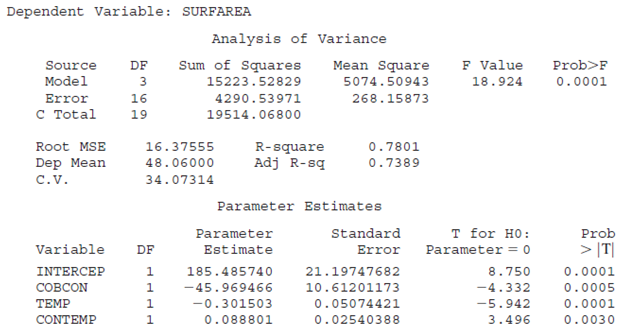
The accompanying Minitab regression output is based on data that appeared in the article “Application of Design of Experiments for Modeling Surface Roughness in Ultrasonic Vibration Turning” (J. of Engr. Manuf., 2009: 641–652). The response variable is surface roughness (μm), and the independent variables are vibration amplitude (μm), depth of cut (μm), feed rate (mm/rev), and cutting speed (m/min), respectively.
- a. How many observations were there in the data set?
- b. Interpret the coefficient of multiple determination.
- c. Carry out a test of hypotheses to decide if the model specifies a useful relationship between the response variable and at least one of the predictors.
- d. Interpret the number 18.2602 that appears in the Coef column.
- e. At significance level .10, can any single one of the predictors be eliminated from the model provided that all of the other predictors are retained?
- f. The estimated SD of
Expert Solution & Answer

Trending nowThis is a popular solution!

Students have asked these similar questions
Wrinkle recovery angle and tensile strength are the two most important characteristics for evaluating the performance of crosslinked cotton fabric. An increase in the degree of crosslinking, as determined by ester carboxyl band absorbance, improves the wrinkle
resistance of the fabric (at the expense of reducing mechanical strength). The accompanying data on x = absorbance and y = wrinkle resistance angle was read from a graph in the paper "Predicting the Performance of Durable Press Finished Cotton Fabric with
Infrared Spectroscopy".†
x 0.115 0.126 0.183 0.246 0.282 0.344 0.355 0.452 0.491 0.554 0.651
y 334 342 355 363
365 372 381 392
400 412 420
Here is regression output from Minitab:
Predictor
Constant
absorb
S = 3.60498
Coef
321.878
156.711
SOURCE
Regression
Residual Error
Total
SE Coef
2.483
6.464
R-Sq = 98.5%
DF
1
9
10
SS
7639.0
117.0
7756.0
T
129.64
24.24
0.000
0.000
R-Sq (adj) = 98.3%
MS
7639.0
13.0
F
P
587.81
(a) Does the simple linear regression model appear to be…
Wrinkle recovery angle and tensile strength are the two most important characteristics for evaluating the performance of crosslinked cotton fabric. An increase in the degree of crosslinking, as determined by ester carboxyl band absorbance, improves the wrinkle resistance of the fabric (at the expense of reducing mechanical
strength). The accompanying data on x = absorbance and y = wrinkle resistance angle was read from a graph in the paper "Predicting the Performance of Durable Press Finished Cotton Fabric with Infrared Spectroscopy".t
半
0.115 0.126 0.183 0.246 0.282 0.344 0.355 0.452 0.491 0.554 0.651
334 342
355
363
365
372
381
392
400
412
420
Here is regression output from Minitab:
Predictor
Coef
SE Coef
P
Constant
321.878
2.483
129.64
0.000
absorb
156.711
6.464
24.24
0.000
S = 3.60498
R-Sq = 98.5%
R-Są (adj) - 98.3%
SOURCE
DF
MS
F
P
Regression
1
7639.0
7639.0
587.81
0.000
Residual Error
9
117.0
13.0
Total
10
7756.0
(a) Does the simple linear regression model appear to be…
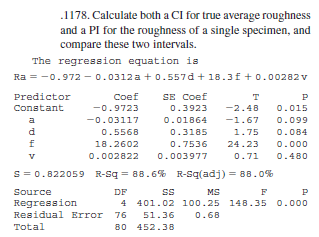
The accompanying Minitab regression output is based on data that appeared in the article "Application of Design of Experiments for Modeling Surface Roughness in Ultrasonic Vibration Turning."+ The response variable is surface roughness (um), and the independent variables are vibration amplitude (um), depth of cut (mm), feed rate (mm/rev), and cutting speed (m/min), respectively.
The regression equation is
Ra = -0.972 - 0.0312a + 0.557d + 18.3f + 0.00282v
Predictor
Coef
SE Coef
Constant
-0.9723
0.3923
-2.48
0.015
-0.03117
0.01864
-1.67
0.099
d
0.5568
0.3185
1.75
0.084
18.2602
0.7536
24.23
0.000
0.002822
0.003977
0.71
0.480
S = 0.822059
Source
R-Sq = 88.6
R-Sq (adj) = 88.04
DS
MS
0.000
Regression
Residual Error
4
401.02
100.25
148.35
76
51.36
0.68
Total
80
452.38
(a) How many observations were there in the data set?
observations
(b) Interpret the coefficient of multiple determination.
O 8.0% of the observed variation in feed rate can be explained by the model relationship with vibration…
Chapter 13 Solutions
Probability and Statistics for Engineering and the Sciences
Ch. 13.1 - Suppose the variables x = commuting distance and y...Ch. 13.1 - Prob. 2ECh. 13.1 - Prob. 3ECh. 13.1 - Prob. 4ECh. 13.1 - As the air temperature drops, river water becomes...Ch. 13.1 - The accompanying scatterplot is based on data...Ch. 13.1 - Prob. 7ECh. 13.1 - Prob. 8ECh. 13.1 - Consider the following four (x, y) data sets; the...Ch. 13.1 - a. Show that i=1nei=0 when the eis are the...
Ch. 13.1 - Prob. 11ECh. 13.1 - Prob. 12ECh. 13.1 - Prob. 13ECh. 13.1 - If there is at least one x value at which more...Ch. 13.2 - No tortilla chip aficionado likes soggy chips, so...Ch. 13.2 - Polyester fiber ropes are increasingly being used...Ch. 13.2 - The following data on mass rate of burning x and...Ch. 13.2 - Failures in aircraft gas turbine engines due to...Ch. 13.2 - Prob. 19ECh. 13.2 - Prob. 20ECh. 13.2 - Mineral mining is one of the most important...Ch. 13.2 - Prob. 22ECh. 13.2 - Prob. 23ECh. 13.2 - Kyphosis refers to severe forward flexion of the...Ch. 13.2 - Prob. 25ECh. 13.3 - The following data on y 5 glucose concentration...Ch. 13.3 - The viscosity (y) of an oil was measured by a cone...Ch. 13.3 - Prob. 29ECh. 13.3 - The accompanying data was extracted from the...Ch. 13.3 - The accompanying data on y 5 energy output (W) and...Ch. 13.3 - Prob. 32ECh. 13.3 - Prob. 33ECh. 13.3 - The following data resulted from an experiment to...Ch. 13.3 - The article The Respiration in Air and in Water of...Ch. 13.4 - Cardiorespiratory fitness is widely recognized as...Ch. 13.4 - A trucking company considered a multiple...Ch. 13.4 - Let y = wear life of a bearing, x1 = oil...Ch. 13.4 - Let y = sales at a fast-food outlet (1000s of ),...Ch. 13.4 - The article cited in Exercise 49 of Chapter 7 gave...Ch. 13.4 - The article A Study of Factors Affecting the Human...Ch. 13.4 - An investigation of a die-casting process resulted...Ch. 13.4 - Prob. 43ECh. 13.4 - The accompanying Minitab regression output is...Ch. 13.4 - The article Analysis of the Modeling Methodologies...Ch. 13.4 - A regression analysis carried out to relate y =...Ch. 13.4 - Efficient design of certain types of municipal...Ch. 13.4 - An experiment to investigate the effects of a new...Ch. 13.4 - Prob. 49ECh. 13.4 - Prob. 50ECh. 13.4 - The article Optimization of Surface Roughness in...Ch. 13.4 - Utilization of sucrose as a carbon source for the...Ch. 13.4 - Prob. 53ECh. 13.4 - Prob. 54ECh. 13.5 - The article The Influence of Honing Process...Ch. 13.5 - Prob. 56ECh. 13.5 - In the accompanying table, we give the smallest...Ch. 13.5 - Prob. 58ECh. 13.5 - Prob. 59ECh. 13.5 - Pillar stability is a most important factor to...Ch. 13.5 - Prob. 61ECh. 13.5 - Prob. 62ECh. 13.5 - Prob. 63ECh. 13.5 - Prob. 64ECh. 13 - Curing concrete is known to be vulnerable to shock...Ch. 13 - Prob. 66SECh. 13 - The article Validation of the Rockport Fitness...Ch. 13 - Feature recognition from surface models of...Ch. 13 - Air pressure (psi) and temperature (F) were...Ch. 13 - An aeronautical engineering student carried out an...Ch. 13 - An ammonia bath is the one most widely used for...Ch. 13 - The article An Experimental Study of Resistance...Ch. 13 - The accompanying data on x = frequency (MHz) and y...Ch. 13 - Prob. 74SECh. 13 - Prob. 75SECh. 13 - The article Chemithermomechanical Pulp from Mixed...Ch. 13 - Prob. 77SECh. 13 - Prob. 78SECh. 13 - Prob. 79SECh. 13 - Prob. 80SECh. 13 - Prob. 81SECh. 13 - Prob. 82SECh. 13 - Prob. 83SE
Knowledge Booster


Learn more about
Need a deep-dive on the concept behind this application? Look no further. Learn more about this topic, statistics and related others by exploring similar questions and additional content below.Similar questions
- What type of model is presented below – Model 3. What impact do d_y and d_rs have on the dependent variable d_m_p? Model 3: OLS, using observations 1980:2-1999:3 (T = 78) Dependent variable: d_m_p Coefficient Std. Error t-ratio p-value const 0.0113971 0.00130078 8.7617 <0.0001 *** d_y −0.0106911 0.100221 −0.1067 0.9153 d_rs 0.00151462 0.00110613 1.3693 0.1751 d_rl 0.000127744 0.00141954 0.0900 0.9285 d_p −0.354204 0.093535 −3.7869 0.0003 *** Mean dependent var 0.007578 S.D. dependent var 0.004753 Sum squared resid 0.001399 S.E. of regression 0.004378 R-squared 0.195607 Adjusted R-squared 0.151531 F(4, 73) 4.437922 P-value(F) 0.002885 Log-likelihood 315.5363 Akaike criterion −621.0725 Schwarz criterion −609.2890 Hannan-Quinn −616.3554 rho 0.485424 Durbin-Watson 1.001216arrow_forwardWrinkle recovery angle and tensile strength are the two most important characteristics for evaluating the performance of crosslinked cotton fabric. An increase in the degree of crosslinking, as determined by ester carboxyl band absorbance, improves the wrinkle resistance of the fabric (at the expense of reducing mechanical strength). The accompanying data on x = absorbance and y = wrinkle resistance angle was read from a graph in the paper "Predicting the Performance of Durable Press Finished Cotton Fabric with Infrared Spectroscopy".t x 0.115 0.126 0.183 0.246 0.282 0.344 0.355 0.452 0.491 0.554 0.651 y 334 342 355 363 365 372 381 400 392 412 420 Here is regression output from Minitab: Predictor Constant absorb S = 3.60498 Coef 321.878 156.711 SOURCE Regression Residual Error Total R-Sq= 98.5% DF SE Coef 2.483 6.464 1 9 10 SS 7639.0 117.0 7756..0 T 129.64 24.24 P 0.000 0.000. R-Sq (adj) 98.3% MS 7639.0 13.0 F 587.81 (a) Does the simple linear regression model appear to be appropriate?…arrow_forwardThe data in the accompanying table include the appraised value, land area of the property in acres, and age, in years, for a small sample of 30 single-family homes in a small city. Perform a multiple regression analysis to predict appraised value based on land area of the property X1 and age, in years, X2 and determine the VIF for each independent variable in the model. Is there reason to suspect the existence of collinearity? Determine the VIF for each independent variable in the model.arrow_forward
- The article "Influence of Freezing Temperature on Hydraulic Conductivity of Silty Clay" (J. Konrad and M. Samson, Journal of Geotechnical and Geoenvironmental Engineering, 2000:180–187) describes a study of factors affecting hydraulic conductivity of soils. The measurements of hydraulic conductivity in units of 108 cm/s (y), initial void ratio (x), and thawed void ratio (x2) for 12 specimens of silty clay are presented in the following table. y 1.01 1.12 1.04 1.30 1.01 1.04 0.955 1.15 1.23 1.28 1.23 1.30 0.84 0.88 0.85 0.95 0.88 0.86 0.85 0.89 0.90 0.94 0.88 0.90 X1 0.81 0.85 0.87 0.92 0.84 0.85 0.85 0.86 0.85 0.92 0.88 0.92 X2 Fit the model y = Bo + fix1 + e. For each coefficient, test the null hypothesis that it is equal to 0. Fit the model y = Bo + Bzx2 + e. For each coefficient, test the null hypothesis that it is equal to 0. Fit the model y = Bo + BzX1 + Bzxz + e. For each coefficient, test the null hypothesis that it is equal to 0. d. Which of the models in parts (a) to (c) is…arrow_forwardSnowpacks contain a wide spectrum of pollutants thatmay represent environmental hazards. The article“Atmospheric PAH Deposition: Deposition Velocitiesand Washout Ratios” (J. of EnvironmentalEngineering, 2002: 186–195) focused on the depositionof polyaromatic hydrocarbons. The authors proposeda multiple regression model for relating depositionover a specified time period (y, in mg/m2) to tworather complicated predictors x1 (mg-sec/m3) and x2 (mg/m2), defined in terms of PAH air concentrations forvarious species, total time, and total amount of precipitation.Here is data on the species fluoranthene andcorresponding Minitab output:obs x1 x2 flth1 92017 .0026900 278.782 51830 .0030000 124.533 17236 .0000196 22.654 15776 .0000360 28.685 33462 .0004960 32.666 243500 .0038900 604.707 67793 .0011200 27.698 23471 .0006400 14.189 13948 .0004850 20.6410 8824 .0003660 20.6011 7699 .0002290 16.6112 15791 .0014100 15.0813 10239 .0004100 18.0514 43835 .0000960 99.7115 49793 .0000896 58.9716 40656…arrow_forwardThe authors of the paper "Predicting Yolk Height, Yolk Width, Albumen Length, Eggshell Weight, Egg Shape Index, Eggshell Thickness, Egg Surface Area of Japanese Quails Using Various Egg Traits as Regressors"t used a multiple regression model with two independent variables where y = quail egg weight (g), X, = egg width (mm), and X2 = egg length (mm). The regression function suggested in the paper is -21.658 + 0.828x, 0.373x2. + (a) What is the mean egg weight for quail eggs that have a width of 20 mm and a length of 48 mm? (Enter your answer to three decimal places.) (b) Interpret the value of B,. O When width is fixed, the mean increase in weight associated with a 1-mm increase in length is 0.373 g. When length is fixed, the mean increase in weight associated with a 1-mm increase in width is 0.373 g. O When length is fixed, the mean increase in weight associated with a 1-mm increase in width is 0.828 g. O When width is fixed, the mean increase in weight associated with a 1-mm increase…arrow_forward
- a) explain on he strenght and variation of the model (multiple regression) b) At a-value =0.01. test whether there is a significiant relationship between the dependent variable (y) and the independant variables x1, x2 and x3arrow_forwardThe article "Earthmoving Productivity Estimation Using Linear Regression Techniques" (S. Smith, Journal of Construction Engineering and Management, 1999:133–141) presents the following linear model to predict earth-moving productivity (in m3 moved per hour): Productivity = - 297.877 + 84.787x, + 36.806x, + 151.680x, – 0.081x, – 110.517x5 - 0.267.x, – 0.016x,x, +0.107.x,x5 + 0.0009448x,x, – 0.244x;x, where X1 = number of trucks X2 = number of buckets per load X3 = bucket volume, in m³ X4 = haul length, in m X5 = match factor (ratio of hauling capacity to loading capacity) X6 = truck travel time, in s If the bucket volume increases by 1 m², while other independent variables are unchanged, can you determine the change in the predicted productivity? If so, determine it. If not, state what other information you would need to determine it. b. If the haul length increases by 1 m, can you determine the change in the predicted productivity? If so, determine it. If not, state what other…arrow_forwardWe conduct a simple regression of size on hhinc. The regression output is reportedin Table 1. Interpret the sign and magnitude of the estimated coefficients.arrow_forward
- The article "Modeling Resilient Modulus and Temperature Correction for Saudi Roads" (H. Wahhab, I. Asi, and R. Ramadhan, Journal of Materials in Civil Engineering, 2001:298– 305) describes a study designed to predict the resilient modulus of pavement from physical properties. The following table presents data for the resilient modulus at 40°Cin10® kPa (y), the surface area of the aggregate in m²/kg (x1), and the softening point of the asphalt in °C (х). y X1 X2 1.48 5.77 60.5 1.70 7.45 74.2 2.03 8.14 67.6 2.86 8.73 70.0 2.43 7.12 64.6 3.06 6.89 65.3 2.44 8.64 66.2 1.29 6.58 64.1 3.53 9.10 68.6 1.04 8.06 58.8 1.88 5.93 63.2 1.90 8.17 62.1 1.76 9.84 68.9 2.82 7.17 72.2 1.00 7.78 54.1 The full quadratic model is y = + P,x, + PzX, + Pz*jXz + Pxx¡ + Bzx; + €. Which submodel of this full model do you believe is most appropriate? Justify your answer by fitting two or more models and comparing the results.arrow_forwardAa Febru The body mass index (BMI) of a person is defined to be the person's body mass divided by the square of the person's height. The article "Influences of Parameter Uncertainties within the ICRP 66 Respiratory Tract Model: Particle Deposition" (W. Bolch, E. Farfan, et al., Health Physics, 2001:378-394) states that body mass index (in kg/m2) in men aged 25-34 is lognormally distributed with parameters u = 3.215 and o = 0.157. a.Find the mean and standard deviation BMI for men aged 25-34. b.Find the standard deviation of BMI for men aged 25-34. c.Find the median BMI for men aged 25-34. d.What proportion of men aged 25-34 have a BMI less than 20? e.Find the 80th percentile of BMI for men agėd 25 -34. 04... Rext 田arrow_forwardDisk drives last time Here is a scatterplot of the residu-als from the regression of the hard drive prices on their sizes from Exercise 18.a) Are any assumptions or conditions violated? If so,which ones?b) What would you recommend about this regression?arrow_forward
arrow_back_ios
SEE MORE QUESTIONS
arrow_forward_ios
Recommended textbooks for you
 Algebra & Trigonometry with Analytic GeometryAlgebraISBN:9781133382119Author:SwokowskiPublisher:Cengage
Algebra & Trigonometry with Analytic Geometry
Algebra
ISBN:9781133382119
Author:Swokowski
Publisher:Cengage
Correlation Vs Regression: Difference Between them with definition & Comparison Chart; Author: Key Differences;https://www.youtube.com/watch?v=Ou2QGSJVd0U;License: Standard YouTube License, CC-BY
Correlation and Regression: Concepts with Illustrative examples; Author: LEARN & APPLY : Lean and Six Sigma;https://www.youtube.com/watch?v=xTpHD5WLuoA;License: Standard YouTube License, CC-BY