
Concept explainers
Videos
(a).
To explain:
Two graphs is misleading with reason.
(a).
Answer to Problem 36E
Explanation of Solution
Given information:
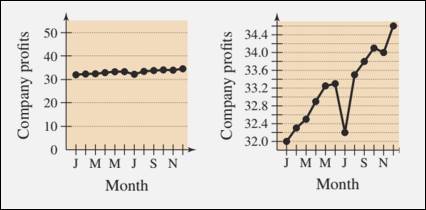
The two graph which are misleading are scatter plot and line plot because line plot is displaying changes over a time period as a series of company profile and scatter plot show how much months is affected by company profile.
(b).
To explain:
Other ways in which graphs can be misleading.
(b).
Answer to Problem 36E
Other ways in which graphs can be misleading is line plot and scatter plot.
Explanation of Solution
Given information:

The other way is the line plot that shows the individual company profits over
Scatter plot shows the relationship in between months and company profits over
(c).
To explain:Reason that it would be beneficial for someone to use a misleading graph.
(c).
Answer to Problem 36E
Someone can be used for reading a nature of the company profiles over
Explanation of Solution
Given information:

Someone can be used for reading a nature of the company profiles over
First someone can use line graph to read company profiles to know in which month the profits get down, when rise and when increase or decrease.
Second by using the scatter plot some can know how the company profits relate with the months.
Chapter B Solutions
Precalculus with Limits: A Graphing Approach


 Calculus: Early TranscendentalsCalculusISBN:9781285741550Author:James StewartPublisher:Cengage Learning
 Thomas' Calculus (14th Edition)CalculusISBN:9780134438986Author:Joel R. Hass, Christopher E. Heil, Maurice D. WeirPublisher:PEARSON
 Calculus: Early Transcendentals (3rd Edition)CalculusISBN:9780134763644Author:William L. Briggs, Lyle Cochran, Bernard Gillett, Eric SchulzPublisher:PEARSON
 Calculus: Early TranscendentalsCalculusISBN:9781319050740Author:Jon Rogawski, Colin Adams, Robert FranzosaPublisher:W. H. Freeman
 Calculus: Early Transcendental FunctionsCalculusISBN:9781337552516Author:Ron Larson, Bruce H. EdwardsPublisher:Cengage Learning