
Concept explainers
Videos
(a).
To graph:
Line graph for the given data.
(a).
Answer to Problem 25E
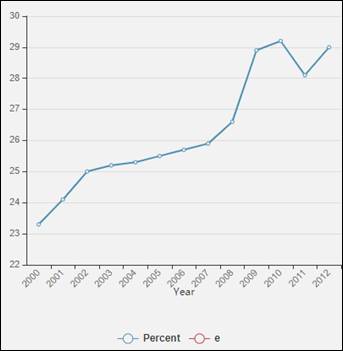
Line graph for the given data is as below:
Explanation of Solution
Given information:
| Year | Percent |
Graph:

Interpretation:
The above graph shows the percent of wives in two income families in the united states who earned more than their husbands from
(b).
To explain:
Brief statement describing the graph reveals.
(b).
Answer to Problem 25E
Number of wives in two income families in the united states who earned more than their husbands is fairly incased at constant rate from the year
Explanation of Solution
Given information:
| Year | Percent |
Result obtained from part (a) that is line graph of the given data is as below:
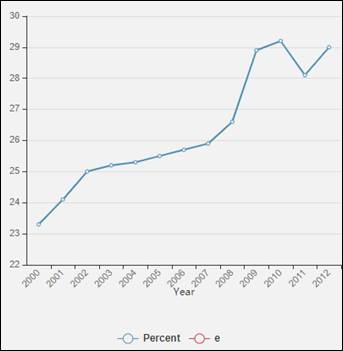
From the above line graph it is observed that, number of wives in two income families in the united states who earned more than their husbands is fairly incased at constant rate from the year
And then after year
Chapter B Solutions
Precalculus with Limits: A Graphing Approach


 Calculus: Early TranscendentalsCalculusISBN:9781285741550Author:James StewartPublisher:Cengage Learning
 Thomas' Calculus (14th Edition)CalculusISBN:9780134438986Author:Joel R. Hass, Christopher E. Heil, Maurice D. WeirPublisher:PEARSON
 Calculus: Early Transcendentals (3rd Edition)CalculusISBN:9780134763644Author:William L. Briggs, Lyle Cochran, Bernard Gillett, Eric SchulzPublisher:PEARSON
 Calculus: Early TranscendentalsCalculusISBN:9781319050740Author:Jon Rogawski, Colin Adams, Robert FranzosaPublisher:W. H. Freeman
 Calculus: Early Transcendental FunctionsCalculusISBN:9781337552516Author:Ron Larson, Bruce H. EdwardsPublisher:Cengage Learning