Precalculus with Limits: A Graphing Approach
7th Edition
ISBN: 9781305071711
Author: Ron Larson
Publisher: Brooks/Cole
bartleby

Concept explainers

bartleby

Videos

Question
Book Icon
Chapter B.1, Problem 26E

(a).

To determine

To graph:

Line graph for the given data.

(a).

Expert Solution
Check Mark

Answer to Problem 26E

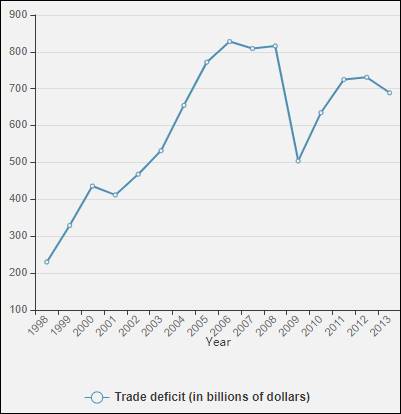
Line graph for the given data is as below:

  Precalculus with Limits: A Graphing Approach, Chapter B.1, Problem 26E , additional homework tip  1

Explanation of Solution

Given information:

    Year Trade deficit (in billions of dollars)
    1998230
    1999329
    2000436
    2001412
    2002468
    2003532
    2004655
    2005772
    2006828
    2007809
    2008816
    2009504
    2010635
    2011725
    2012731
    2013689

Graph:

  Precalculus with Limits: A Graphing Approach, Chapter B.1, Problem 26E , additional homework tip  2

Interpretation:

The above graph shows the trade deficits (the differences between imports and exports) of the United States from 1998 through 2013 .

(b).

To determine

To explain:

Brief statement describing the graph reveals.

(b).

Expert Solution
Check Mark

Answer to Problem 26E

From the year 1998 to 2000 increased at constant rate then after 2008 sudden decreased at constant rate and then again slight increased in rate after year 2009 .

Explanation of Solution

Given information:

    Year Trade deficit (in billions of dollars)
    1998230
    1999329
    2000436
    2001412
    2002468
    2003532
    2004655
    2005772
    2006828
    2007809
    2008816
    2009504
    2010635
    2011725
    2012731
    2013689

Result obtained from part (a) that is line graph of the given data is as below:

  Precalculus with Limits: A Graphing Approach, Chapter B.1, Problem 26E , additional homework tip  3

From the above line graph it is observed that, trade deficits (the differences between imports and exports) of the United States from 1998 to 2000 increased at constant rate.

After year 2000 to 2008 trade deficits (the differences between imports and exports) of the United States slightly increases at different rates and then after 2008 sudden decreased at constant rate and then again slight increased in rate after year 2009 .

Chapter B Solutions

Precalculus with Limits: A Graphing Approach

Ch. B.1 - Prob. 11ECh. B.1 - Prob. 12ECh. B.1 - Prob. 13ECh. B.1 - Prob. 14ECh. B.1 - Prob. 15ECh. B.1 - Prob. 16ECh. B.1 - Prob. 17ECh. B.1 - Prob. 18ECh. B.1 - Prob. 19ECh. B.1 - Prob. 20ECh. B.1 - Prob. 21ECh. B.1 - Prob. 22ECh. B.1 - Prob. 23ECh. B.1 - Prob. 24ECh. B.1 - Prob. 25ECh. B.1 - Prob. 26ECh. B.1 - Prob. 27ECh. B.1 - Prob. 28ECh. B.1 - Prob. 29ECh. B.1 - Prob. 30ECh. B.1 - Prob. 31ECh. B.1 - Prob. 32ECh. B.1 - Prob. 33ECh. B.1 - Prob. 34ECh. B.1 - Prob. 35ECh. B.1 - Prob. 36ECh. B.1 - Prob. 37ECh. B.2 - Prob. 1ECh. B.2 - Prob. 2ECh. B.2 - Prob. 3ECh. B.2 - Prob. 4ECh. B.2 - Prob. 5ECh. B.2 - Prob. 6ECh. B.2 - Prob. 7ECh. B.2 - Prob. 8ECh. B.2 - Prob. 9ECh. B.2 - Prob. 10ECh. B.2 - Prob. 11ECh. B.2 - Prob. 12ECh. B.2 - Prob. 13ECh. B.2 - Prob. 14ECh. B.2 - Prob. 15ECh. B.2 - Prob. 16ECh. B.2 - Prob. 17ECh. B.2 - Prob. 18ECh. B.2 - Prob. 19ECh. B.2 - Prob. 20ECh. B.2 - Prob. 21ECh. B.2 - Prob. 22ECh. B.2 - Prob. 23ECh. B.2 - Prob. 24ECh. B.2 - Prob. 25ECh. B.2 - Prob. 26ECh. B.2 - Prob. 27ECh. B.2 - Prob. 28ECh. B.2 - Prob. 29ECh. B.2 - Prob. 30ECh. B.2 - Prob. 31ECh. B.2 - Prob. 32ECh. B.2 - Prob. 33ECh. B.2 - Prob. 34ECh. B.2 - Prob. 35ECh. B.2 - Prob. 36ECh. B.2 - Prob. 37ECh. B.2 - Prob. 38ECh. B.2 - Prob. 39ECh. B.2 - Prob. 40ECh. B.2 - Prob. 41ECh. B.2 - Prob. 42ECh. B.2 - Prob. 43ECh. B.2 - Prob. 44ECh. B.2 - Prob. 45ECh. B.2 - Prob. 46ECh. B.2 - Prob. 47ECh. B.2 - Prob. 48ECh. B.2 - Prob. 49ECh. B.2 - Prob. 50ECh. B.3 - Prob. 1ECh. B.3 - Prob. 2ECh. B.3 - Prob. 3ECh. B.3 - Prob. 4E
Knowledge Booster
Background pattern image
Calculus
Learn more about
Need a deep-dive on the concept behind this application? Look no further. Learn more about this topic, calculus and related others by exploring similar questions and additional content below.
Recommended textbooks for you
Text book image
Calculus: Early Transcendentals
Calculus
ISBN:9781285741550
Author:James Stewart
Publisher:Cengage Learning
Text book image
Thomas' Calculus (14th Edition)
Calculus
ISBN:9780134438986
Author:Joel R. Hass, Christopher E. Heil, Maurice D. Weir
Publisher:PEARSON
Text book image
Calculus: Early Transcendentals (3rd Edition)
Calculus
ISBN:9780134763644
Author:William L. Briggs, Lyle Cochran, Bernard Gillett, Eric Schulz
Publisher:PEARSON
Text book image
Calculus: Early Transcendentals
Calculus
ISBN:9781319050740
Author:Jon Rogawski, Colin Adams, Robert Franzosa
Publisher:W. H. Freeman
Text book image
Precalculus
Calculus
ISBN:9780135189405
Author:Michael Sullivan
Publisher:PEARSON
Text book image
Calculus: Early Transcendental Functions
Calculus
ISBN:9781337552516
Author:Ron Larson, Bruce H. Edwards
Publisher:Cengage Learning
Correlation Vs Regression: Difference Between them with definition & Comparison Chart; Author: Key Differences;https://www.youtube.com/watch?v=Ou2QGSJVd0U;License: Standard YouTube License, CC-BY
Correlation and Regression: Concepts with Illustrative examples; Author: LEARN & APPLY : Lean and Six Sigma;https://www.youtube.com/watch?v=xTpHD5WLuoA;License: Standard YouTube License, CC-BY