
Concept explainers
Videos
Teams in the National Football League (NFL) are given a “bye” during one week of the season, when they can rest and not play a game. This may provide an advantage for the team in the next game they play after a bye.
In 2016, each of the 32 NFL teams was granted a bye during one of the weeks of the season. The following table contains the team name and the number of points they won by or lost by in the game after the bye (espn.com/nfl/, retrieved December 22, 2016). A positive value indicates that the team coming off the bye won the game, and a negative value means that they lost. You may consider these results to be a representative sample from a population of possible NFL matchups between teams where one of the teams is coming off a bye week.
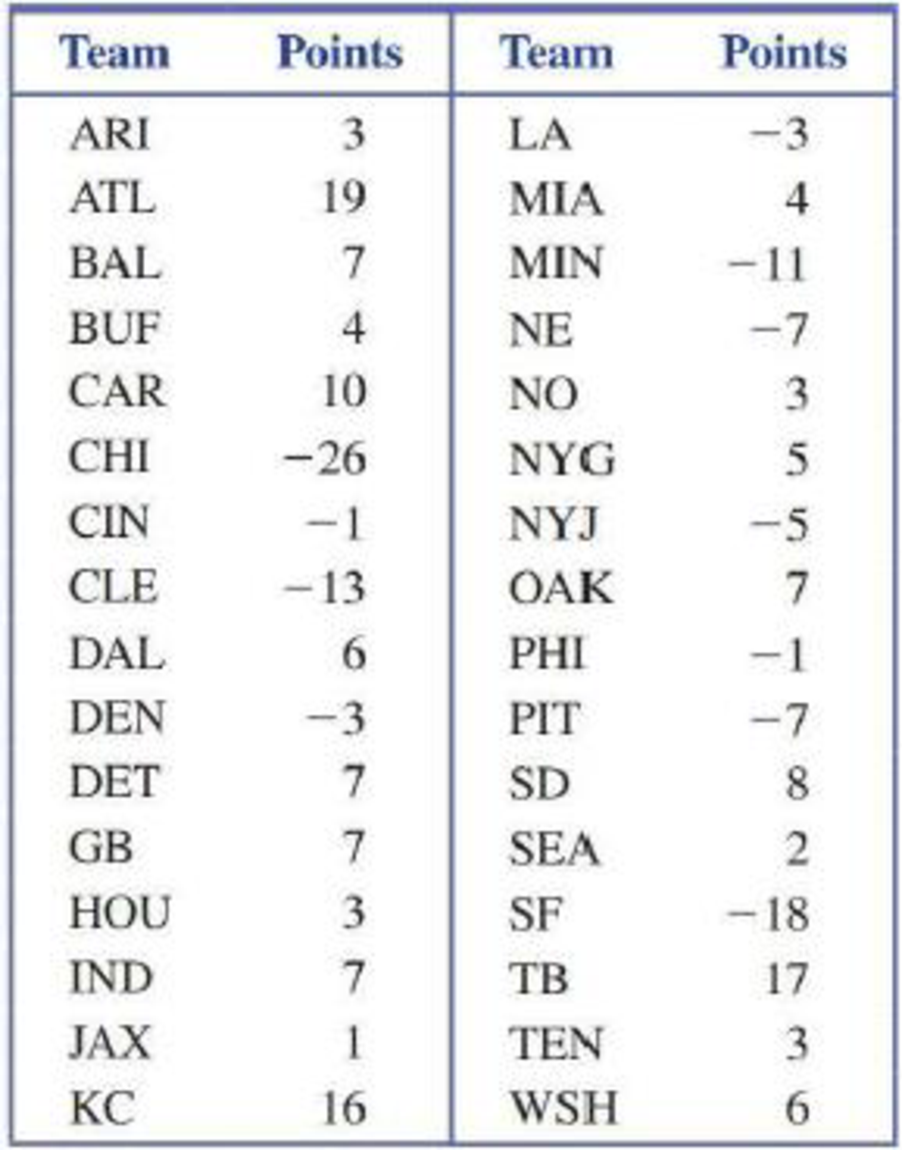
- a. Construct a graphical display for the data. Although the
sample size is at least on the borderline of being adequate for t distribution methods, what characteristic of the distribution indicates that the methods based on the t distribution may not be appropriate? - b. Use a bootstrap confidence
interval to estimate the populationmean point difference for NFL teams coming off a bye week using a 95% confidence interval. - c. Use the results from Part (b) to explain whether or not you believe that teams coming off a bye week have a significant advantage in points scored over their opponents.
Want to see the full answer?
Check out a sample textbook solution
Chapter 9 Solutions
Introduction To Statistics And Data Analysis


- If a man has 4 sweaters and 5 pairs of slacks, how many different outfit can he wear?arrow_forwardSuppose you have a choice of ten TV sets that can be matched with any of six DVR players and eight DVD players. How many different TV/DVR/DVD systems can you assemble?arrow_forwardThree Players were numbered as 1, 2, and 3. How many teams of two players can be formed? List down all possible teams of two players below.arrow_forward
- please answer questions c,d,e.arrow_forwardIn the provided table, the education information and incomes of 73,736 people are given. The rows are labeled with education status and the columns are labeled with income range. The total of all entries in each row gives the total number of people with the corresponding education status and similarly, the total of all entries of a particular column gives the number of people with the corresponding income range. Please answer subpart 4 and 5.arrow_forwardThere are 15 children in soccer training squad. A team consist of 11 players. If two children can play in a goal, how many different teams can be formed?arrow_forward
- A communications class surveyed 150 students and found that 115 had seen the movie “Titanic” while 65 had seen “Forrest Gump” and 42 had seen both. How many people had not seen either movie?arrow_forwardFind the mode of the following number of stingrays spotted by each person during a snorkeling trip. 11,5,7,5,11,1,7,4,1,7,7arrow_forwardlon? C12. The following table presents the number of parolees (per 100,000 people) for 12 of the most populous states as of July 2015. State Parolees (per 100,000 people) California 292 Texas 556 New York 288arrow_forward
- One common system for computing a grade point average (GPA) assigns 4 points to an A, 3 points to a B, 2 points to a C, 1 point to a D, and 0 points to an F. What is the GPA of a student who gets an A in a 33-credit course, a B in each of twotwo 22-credit courses, a C in a 33-credit course, and a D in a 22-credit course?arrow_forwardOf the 328 patients that completed the survey last year, 211 of them claimed to be returning patients. Name the population and the sample in the survey above.arrow_forwardWhat could be the game schedule bracket for the 12 teams of basketball tournament playing from the single elimination to the championship game.arrow_forward
 Algebra & Trigonometry with Analytic GeometryAlgebraISBN:9781133382119Author:SwokowskiPublisher:Cengage
 College Algebra (MindTap Course List)AlgebraISBN:9781305652231Author:R. David Gustafson, Jeff HughesPublisher:Cengage Learning
 Elementary Geometry for College StudentsGeometryISBN:9781285195698Author:Daniel C. Alexander, Geralyn M. KoeberleinPublisher:Cengage Learning
 Holt Mcdougal Larson Pre-algebra: Student Edition...AlgebraISBN:9780547587776Author:HOLT MCDOUGALPublisher:HOLT MCDOUGAL
 Algebra: Structure And Method, Book 1AlgebraISBN:9780395977224Author:Richard G. Brown, Mary P. Dolciani, Robert H. Sorgenfrey, William L. ColePublisher:McDougal Littell