
Videos
(a)
To Find: The first difference of the data shown in Table 1 then find the linear model that approximates the data.
(a)
Answer to Problem 75E
The required linear model is
Explanation of Solution
Given:
The value
The given table is shown in table 1
Table 1
| Year | Number of Residents |
| 2010 | 4785 |
| 2011 | 4801 |
| 2012 | 4816 |
| 2013 | 4831 |
| 2014 | 4846 |
| 2015 | 4859 |
Calculation:
Consider the difference from the given table as,
Consider the points
(b)
To Find: The graphing utility to find the number of linear model for the data and compare the model of part (a),
(b)
Answer to Problem 75E
The linear model is
Explanation of Solution
Input the n values on L1 and
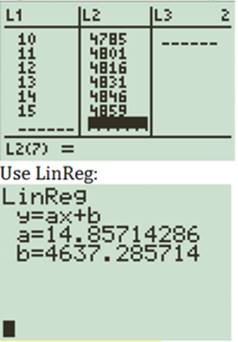
Figure 1
From the above results the linear model is
(c)
To Find: The prediction for the number of residents in 2021 and determine how the values compare.
(c)
Answer to Problem 75E
The number of residents is
Explanation of Solution
From part (b) use
From part (b) use
Thus, the values are similar of part (a) and part (b).
Chapter 9 Solutions
EBK PRECALCULUS W/LIMITS


 Calculus: Early TranscendentalsCalculusISBN:9781285741550Author:James StewartPublisher:Cengage Learning
 Thomas' Calculus (14th Edition)CalculusISBN:9780134438986Author:Joel R. Hass, Christopher E. Heil, Maurice D. WeirPublisher:PEARSON
 Calculus: Early Transcendentals (3rd Edition)CalculusISBN:9780134763644Author:William L. Briggs, Lyle Cochran, Bernard Gillett, Eric SchulzPublisher:PEARSON
 Calculus: Early TranscendentalsCalculusISBN:9781319050740Author:Jon Rogawski, Colin Adams, Robert FranzosaPublisher:W. H. Freeman
 Calculus: Early Transcendental FunctionsCalculusISBN:9781337552516Author:Ron Larson, Bruce H. EdwardsPublisher:Cengage Learning