
Concept explainers
Videos
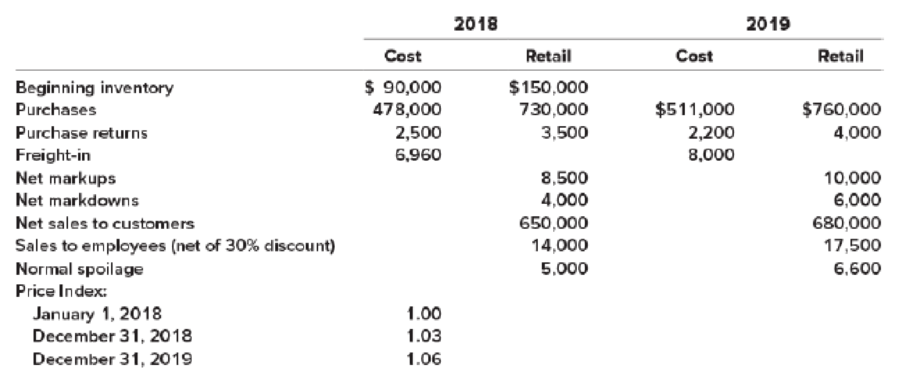
Retail inventory method; various applications
• LO9–3 through LO9–5
On January 1, 2018, Pet Friendly Stores adopted the retail inventory method. Inventory transactions at both cost and retail, and cost indexes for 2018 and 2019 are as follows:
Required:
- 1. Estimate the 2018 and 2019 ending inventory and cost of goods sold using the dollar-value LIFO retail method.
- 2. Estimate the 2018 ending inventory and cost of goods sold using the average cost retail method.
- 3. Estimate the 2018 ending inventory and cost of goods sold using the conventional retail method.
1.
Dollar-Value-LIFO
This method shows all the inventory figures at dollar price rather than units. Under this inventory method, the units that are purchased last, are sold first. Thus, it starts from the selling of the units recently purchased and ending with the beginning inventory.
To Estimate: the ending inventory and cost of goods sold in 2018 using dollar-value LIFO retail method.
Explanation of Solution
Calculate the amount of estimated ending inventory and cost of goods sold at retail.
| Details | Cost ($) | Retail ($) |
| Beginning inventory | 90,000 | 150,000 |
| Add: Net purchase | 478,000 | 730,000 |
| Freight-in | 6,960 | |
| Net markups | 8,500 | |
| Less: Net markdowns | (4,000) | |
| Purchase returns | (2,500) | (3,500) |
| Goods available for sale – Excluding beginning inventory | 482,460 | 731,000 |
| Goods available for sale – Including beginning inventory | 572,460 | 881,000 |
| Less: Normal spoilage | 0 | (5,000) |
| Net sales | (664,000) | |
| Employees discounts | (6,000) | |
| Estimated ending inventory at current year retail prices | 206,000 | |
| Estimated ending inventory at cost (Refer Table 2) | (123,990) | |
| Estimated Cost of Goods Sold | 448,470 |
Table (1)
Working Notes:
Calculate base layer cost-to retail percentage.
Calculate current year cost-to retail percentage.
Calculate the amount of estimated ending inventory at cost.
| Ending inventory at dollar-value LIFO retail cost | ||||
| Ending inventory at year-end retail prices ($) | Ending inventory at base year retail prices ($) | Inventory layers at base year retail prices ($) | Inventory layers converted to cost ($) | |
| 206,000 | 200,000 | 150,000 (Base) | 90,000 | |
| 50,000 (2018) | 33,990 | |||
| Total ending inventory at dollar-value LIFO retail cost | 123,990 | |||
Table (2)
Calculate the amount of ending inventory at base year retail prices.
Calculate the amount of inventory layers at base year retail prices.
Calculate the amount of inventory layers at current year retail prices.
Calculate the amount of inventory layers converted to cost (Base).
Calculate the amount of inventory layers converted to cost (2018).
Calculate the amount of estimated ending inventory and cost of goods sold at retail.
| Details | Cost ($) | Retail ($) |
| Beginning inventory | 123,990 | 206,000 |
| Add: Net purchase | 511,000 | 760,000 |
| Freight-in | 8,000 | |
| Net markups | 10,000 | |
| Less: Net markdowns | (6,000) | |
| Purchase returns | (2,200) | (4,000) |
| Goods available for sale – Excluding beginning inventory | 516,800 | 760,000 |
| Goods available for sale – Including beginning inventory | 640,790 | 966,000 |
| Less: Normal spoilage | 0 | (6,600) |
| Net sales | (697,500) | |
| Employees discounts | (7,500) | |
| Estimated ending inventory at current year retail prices | 254,400 | |
| Estimated ending inventory at cost (Refer Table 4) | (152,822) | |
| Estimated Cost of Goods Sold | 487,968 |
Table (3)
Working Notes:
Calculate base layer cost-to retail percentage.
Calculate 2018 year cost-to retail percentage.
Calculate current year cost-to retail percentage.
Calculate the amount of estimated ending inventory at cost.
| Ending inventory at dollar-value LIFO retail cost | ||||
| Ending inventory at year-end retail prices ($) | Ending inventory at base year retail prices ($) | Inventory layers at base year retail prices ($) | Inventory layers converted to cost ($) | |
| 254,400 | 240,000 | 150,000 (Base) | 90,000 | |
| 50,000 (2018) | 33,990 | |||
| 40,000 (2019) | 28,832 | |||
| Total ending inventory at dollar-value LIFO retail cost | 152,822 | |||
Table (4)
Calculate the amount of ending inventory at base year retail prices.
Calculate the amount of inventory layers at base year retail prices.
Calculate the amount of inventory layers at current year retail prices.
Calculate the amount of inventory layers converted to cost (Base).
Calculate the amount of inventory layers converted to cost (2018).
Calculate the amount of inventory layers converted to cost (2019).
2.
Average cost
It is amethod of determining the cost-to retail percentage for all the goods available for sale.
To Calculate: The amount of ending inventory and cost of goods sold.
Explanation of Solution
The following table shows the ending inventory and cost of goods sold.
| Details | Cost ($) | Retail ($) |
| Beginning inventory | 90,000 | 150,000 |
| Add: Net purchase | 478,000 | 730,000 |
| Freight-in | 6,960 | |
| Net markups | 8,500 | |
| Less: Purchase Returns | (2,500) | (3,500) |
| Net markdowns | (4,000) | |
| Goods available for sale | 572,460 | 881,000 |
| Less: Normal spoilage | (5,000) | |
| Net sales | (664,000) | |
| Employees discounts | (6,000) | |
| Estimated ending inventory at retail | 206,000 | |
| Estimated ending inventory at cost(1) | (133,859) | |
| Estimated Cost of Goods Sold | 438,601 |
Table (5)
Working Note:
Calculate cost-to-retail percentage.
Calculate the amount of estimated ending inventory at cost.
3.
Conventional Retail Method
Conventional retail method refers to the estimation of the lower of average cost or market by eliminating the markdowns from the calculation of the cost-to-retail percentage.
In this case, the cost-to-retail percentage will be determined by dividing the goods available for sale at cost by the goods available for at retail (excluding markdowns). Thus, the conventional retail method will always result in lower estimation of ending inventory when the markdowns exist.
To Calculate: The amount of ending inventory and cost of goods sold.
Explanation of Solution
The following table shows the ending inventory and cost of goods sold.
| Details | Cost ($) | Retail ($) |
| Beginning inventory | 90,000 | 150,000 |
| Add: Net purchase | 478,000 | 730,000 |
| Freight-in | 6,960 | |
| Net markups | 8,500 | |
| Less: Purchase Returns | (2,500) | (3,500) |
| Net markdowns | (4,000) | |
| Goods available for sale | 572,460 | 881,000 |
| Less: Normal spoilage | (5,000) | |
| Net sales | (664,000) | |
| Employees discounts | (6,000) | |
| Estimated ending inventory at retail | 206,000 | |
| Estimated ending inventory at cost(2) | (133,241) | |
| Estimated Cost of Goods Sold | 439,219 |
Table (6)
Working Note:
Calculate cost-to-retail percentage.
Calculate the amount of estimated ending inventory at cost.
Want to see more full solutions like this?
Chapter 9 Solutions
INTERMEDIATE ACCOUNTING, W/CONNECT


- ( Appendix 6B) Inventory Costing Methods Grencia Company uses a periodic inventory system. For 2018 and 2019, Grencia has the following data (assume all purchases and sales are for cash): Required: 1. Compute cost of goods sold, the cost of ending inventory, and gross margin for each year using FIFO. 2. Compute cost of goods sold, the cost of ending inventory, and gross margin for each year using LIFO. 3. Compute cost of goods sold, the cost of ending inventory, and gross margin for each year using the average cost method. ( Note: Use four decimal places for per unit calculations and round all other numbers to the nearest dollar.) 4. CONCEPTUAL CONNECTION Which method would result in the lowest amount paid for taxes? 5. CONCEPTUAL CONNECTION Which method produces the most realistic amount for income? For inventory? Explain your answer. 6. CONCEPTUAL CONNECTION What is the effect of purchases made later in the year on the gross margin when LIFO is employed? When FIFO is employed? Be sure to explain why any differences occur. 7. CONCEPTUAL CONNECTION If you worked Problem 6-68B, compare your answers. What are the differences? Be sure to explain why any differences occurred.arrow_forward( Appendix 6B) Refer to the information for Morgan Inc. above. If Morgan uses a periodic inventory system, what is the cost of goods sold under FIFO at April 30? a. $32,800 b. $38,400 c. $63,600 d. $69,200arrow_forward( Appendix 6B) Inventory Costing Methods: Periodic System Harrington Company had the following data for inventory during a recent year: Assume that Harrington uses a periodic inventory accounting system. Required: 1. Using the FIFO, LIFO, and average cost methods, compute the ending inventory and cost of goods sold. ( Note: Use four decimal places for per-unit calculations and round all other numbers to the nearest dollar.) 2. CONCEPTUAL CONNECTION Which method will produce the most realistic amount for income? For inventory? 3. CONCEPTUAL CONNECTION Which method will produce the lowest amount paid for taxes?arrow_forward
- Required information Problem 9-13 (Algo) Retail inventory method; various applications [LO9-3, 9-4, 9-5] [The following information applies to the questions displayed below.] On January 1, 2021, Pet Friendly Stores adopted the retail inventory method. Inventory transactions at both cost and retail, and cost indexes for 2021 and 2022 are as follows: Beginning inventory Purchases Purchase returns Freight-in Net markups Net markdowns Net sales to customers Sales to employees (net of 20% discount) Normal spoilage Price Index: January 1, 2021 December 31, 2021 December 31, 2022 Problem 9-13 (Algo) Part 2 X Answer is complete but not entirely correct. Average Cost Retail Method Estimated ending inventory at retail Estimated ending inventory at cost Estimated cost of goods sold $ $ $ 950,400 x 725,191 X (236,600) X 2021 Cost Retail $105,400 $170,000 430,000 622,000 4,000 2,900 6,200 1.00 1.04 1.20 5,150 4,150 500,000 14,400 1,900 Required: 2. Estimate the 2021 ending inventory and cost of…arrow_forwardSP9: Supplemental Retail Inventory Method problem ABC periodic inventory system and the retail inventory method to estimate ending inventory and cost of goods sold at Year End. Use the following information to answer the questions below: Cost Retail Beginning inventory Purchases Purchase returns Transfer in Net markups Net markdowns 76 Sates Sales Returns Sales Discount 99200 310000 10000 5280 160000 480000 20000 10000 10000 8000 440,000 6000 5000 Estimate Ending Inventory and COGS using the Conventional Retail Method Estimate Ending Inventory and COGS using the LIFO Retail Method Estimate Ending Inventory and COGS using the DV LIFO Retail Method - Assume that retail prices increased 10% (from 1.00 to 1.1) from base year (previous year end) to current year endarrow_forwardProblem 9-13 (Algo) Retail inventory method; various applications [LO9-3, 9-4, 9-5] [The following information applies to the questions displayed below.] On January 1, 2024, Pet Friendly Stores adopted the retail inventory method. Inventory transactions at both cost and retail, and cost indexes for 2024 and 2025 are as follows: Beginning inventory Purchases Purchase returns Freight-in Net markups Net markdowns Net sales to customers Sales to employees (net of 20% discount) Normal spoilage Price Index: January 1, 2024 December 31, 2024 December 31, 2025 Problem 9-13 (Algo) Part 1 Estimated ending inventory at retail Estimated ending inventory at cost Estimated cost of goods sold $ $ $ 2024 2024 Cost Retail $ 150,500 $ 215,000 640,000 852,000 2,700 6,800 5,650 474,400 $ 354,756 $ (579,600) $ 1.00 1.25 1.25 2025 Required: 1. Estimate the 2024 and 2025 ending inventory and cost of goods sold using the dollar-value LIFO retail method. Note: Round your cost-to-retail percentage calculation…arrow_forward
- 31. Apply the Retail Inventory Method to calculate the cot of ending invery Cost Beginning inventory Net purchanes Sales Ratail $20.224 $31600 59.508 97000 .00arrow_forwardMC41 Syvels Trading uses the retail inventory method to estimate inventory. accounting records for the year ended December 31, 2019: The following information was obtained from the At cost: Inventory, January 1 – P617,000; Purchases - P1,281,000; Purchase returns P21,000; Freight-in - P31,000. At retail: P2,158,000; Purchase returns Sales returns - P62,000. Purchases P35,000; Sales - P2,365,000; Inventory, January 1 P1,057,000%3; How much is the cost of inventory pilferage if the physical count revealed an ending inventory at retail of P780,000?arrow_forward1. Estimate ending inventory for 2022 using the conventional retail method.arrow_forward
- Estimating Inventory Using Retail Inventory Method—Conventional Retail-Mart values its inventory using the conventional retail inventory method. It discloses the following data for the month of June 2020. Cost Selling Price Inventory, June 1 $172,160 $256,000 Markdowns 67,200 Markups 92,800 Markdown cancellations 32,000 Markup cancellations 28,800 Purchases 554,240 715,520 Sales 800,000 Purchase returns and allowances 9,600 11,520 Sales returns and allowances 32,000 Compute estimated inventory at June 30, 2020, using the conventional retail inventory method. $Answerarrow_forwardProblem 9-13 (Algo) Retail inventory method; various applications [LO9-3, 9-4, 9-5] Skip to question [The following information applies to the questions displayed below.] On January 1, 2021, Pet Friendly Stores adopted the retail inventory method. Inventory transactions at both cost and retail, and cost indexes for 2021 and 2022 are as follows: 2021 2022 Cost Retail Cost Retail Beginning inventory $ 162,500 $ 250,000 Purchases 800,000 1,084,000 $ 680,000 $ 1,063,000 Purchase returns 7,000 12,150 2,000 4,300 Freight-in 12,500 2,000 Net markups 6,900 11,800 Net markdowns 4,750 8,000 Net sales to customers 950,000 722,000 Sales to employees (net of 25% discount) 22,500 22,500 Normal spoilage 4,200 6,900 Price Index: January 1, 2021 1.00…arrow_forwardDashboard CengageNOWV2| Onlin X ps://v2.cengagenow.com/ilm/takeAssignment/takeAssignmentMain.do?invoker=&takeAssignmentSessionLocator=&inprogress=false Calculator Delmar Industries uses the perpetual inventory method in accounting for inventory. Prepare the necessary adjusting entry for each of the following independent cases using the cost of goods sold accoun If an amount box does not require an entry, leave it blank. Case 1 Physical count as of April 30 $43,100 Perpetual inventory records as of April 30 41,800 Page: 1 POST. DATE DESCRIPTION DEBIT CREDIT REF. 1 Apг. 30 If an amount box does not require an entry, leave it blank. Case 2 Physical count as of April 30 $37,800 Perpetual inventory records as of April 30 38,300 Page: 1 POST. DATE DESCRIPTION DEBIT CREDIT REF. 1 Apr. 30 2. 1, 2. 2.arrow_forward
 Cornerstones of Financial AccountingAccountingISBN:9781337690881Author:Jay Rich, Jeff JonesPublisher:Cengage Learning