To calculate: The increase in equilibrium
Answer to Problem 1TY

The equilibrium level of GDP increases to $200 .
Explanation of Solution
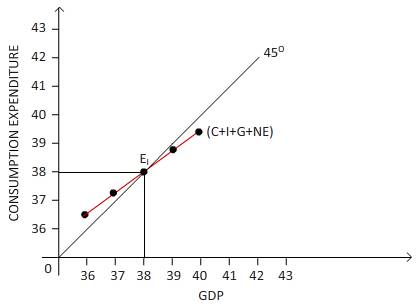
According to the data given, the graph can be drawn as follows:

In this figure, GDP is measured on the horizontal axis while the consumption expenditure is on vertical axis. At point E1 the 45 degree line intersects with the plotted line of GDP and consumption expenditure combination, where both GDP and domestic expenditure are at $3,800. Therefore the equilibrium GDP is $3,800.
The consumption expenditure has changed as the investment increased to $260. Therefore it can be written as
| GDP | Consumption | Investment | Government purchases | Net export | Consumption Expenditure |
| 3,600 | 3,220 | 260 | 120 | 40 | 3,640 |
| 3,700 | 3,310 | 260 | 120 | 40 | 3,730 |
| 3,800 | 3,400 | 260 | 120 | 40 | 3,820 |
| 3,900 | 3,490 | 260 | 120 | 40 | 3,910 |
| 4,000 | 3,580 | 260 | 120 | 40 | 4000 |
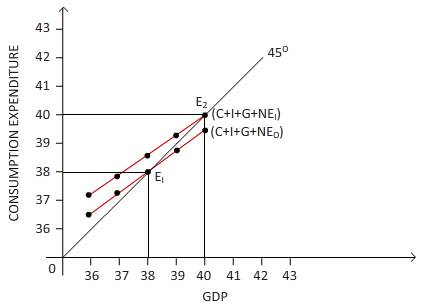
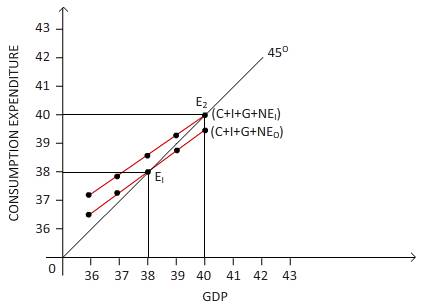
The equilibrium level of GDP and consumption expenditure is changed because the investment level is increased. So the new equilibrium level of GDP and consumption expenditure can be plotted as follows:

The GDP is measured on horizontal axis and on vertical axis the consumer expenditure is measured.
There is a shift of consumption expenditure from (C + I + G +NE) to (C + I + G + NE1) due to the increase in investment. Point E2 is the current equilibrium point where the consumption cost is equal to the amount of GDP and the 45 degree line intersects. The amount of GDP equilibrium rises to $200 due to the investment rise of $20.
Introduction:
GDP represents the Gross Domestic Product. It can be defined as the market value of all the finished goods produced in a given period in a country. GDP may be measured periodically, but is usually performed annually. Nominal GDP, Real GDP, growth rate of GDP and per capita GDP are various forms of GDP measurements.
Want to see more full solutions like this?
- The Firm's Output Decision (Study Plan 12.2) Use the following table to work Problems 4 to 6. Pat's Pizza Kitchen is a price taker. Its costs are Output (pizzas per hour) Total cost (dollars per hour) 0 10 1 21 2 30 3 41 4 54 5 69 4. Calculate Pat's profit-maximizing output and economic profit if the market price is (i) $14 a pizza. (ii) $12 a pizza. (iii) $10 a pizza. 5. What is Pat's shutdown point and what is Pat's economic profit if it shuts down temporarily? 6. Derive Pat's supply curve.arrow_forwardUse the following table to work Problems 27 and 28. ProPainters hires students at $250 a week to paint houses. It leases equipment at $500 a week. The table sets out its total product schedule. Labor (students) 1 Output (houses painted per week) 2 23 5 3 9 4 12 5 14 6 15 27. If ProPainters paints 12 houses a week, calculate its total cost, average total cost, and marginal cost. At what output is average total cost a minimum? 28. Explain why the gap between ProPainters' total cost and total variable cost is the same no matter how many houses are painted.arrow_forwardUse the following table to work Problems 17 to 20. The table shows the production function of Jackie's Canoe Rides. Labor Output (rides per day) (workers per day) Plant 1 Plant 2 Plant 3 Plant 4 10 20 40 55 65 20 40 60 75 85 30 65 75 90 100 40 75 85 100 110 Canoes 10 20 30 40 Jackie's pays $100 a day for each canoe it rents and $50 a day for each canoe operator it hires. 19. a. On Jackie's LRAC curve, what is the average cost of producing 40, 75, and 85 rides a week? b. What is Jackie's minimum efficient scale?arrow_forward
- Not use ai pleasearrow_forward1. Riaz has a limited income and consumes only Apple and Bread. His current consumption choice is 3 apples and 5 bread. The price of apple is $3 each, and the price of bread is $2.5 each. The last apple added 5 units to Sadid's utility, while the last bread added 7 units. Is Riaz making the utility-maximizing choice? Why or why not? Do you suggest any adjustment in Riaz's consumption bundle? Why or why not? Give reasons in support of your answer. State the condition for a consumer's utility maximizing choice and illustrate graphically. 2. Consider the following table of long-run total costs for three different firms: Quantity Total Cost ($) Firm A Firm B Firm C 1 60 11 21 2 70 24 34 3 80 39 49 4 90 56 66 5 100 75 85 6 110 96 106 7 120 119 129 Does each of these firms experience economies of scale or diseconomies of scale? Explain your answer with necessary calculations.arrow_forwardRiaz has a limited income and consumes only Apple and Bread. His current consumption choice is 3 apples and 5 bread. The price of apple is $3 each, and the price of bread is $2.5 each. The last apple added 5 units to Sadid's utility, while the last bread added 7 units. Is Riaz making the utility-maximizing choice? Why or why not? Do you suggest any adjustment in Riaz's consumption bundle? Why or why not? Give reasons in support of your answer.State the condition for a consumer's utility maximizing choice and illustrate graphically.arrow_forward
- 1. Riaz has a limited income and consumes only Apple and Bread. His current consumption choice is 3 apples and 5 bread. The price of apple is $3 each, and the price of bread is $2.5 each. The last apple added 5 units to Sadid's utility, while the last bread added 7 units. Is Riaz making the utility-maximizing choice? Why or why not? Do you suggest any adjustment in Riaz's consumption bundle? Why or why not? Give reasons in support of your answer. State the condition for a consumer's utility maximizing choice and illustrate graphically.arrow_forward1. Riaz has a limited income and consumes only Apple and Bread. His current consumption choice is 3 apples and 5 bread. The price of apple is $3 each, and the price of bread is $2.5 each. The last apple added 5 units to Sadid's utility, while the last bread added 7 units. Is Riaz making the utility-maximizing choice? Why or why not? Do you suggest any adjustment in Riaz's consumption bundle? Why or why not? Give reasons in support of your answer. State the condition for a consumer's utility maximizing choice and illustrate graphically.arrow_forward2. Consider the following table of long-run total costs for three different firms: Quantity Total Cost ($) Firm A Firm B Firm C 1 60 11 21 2 70 24 34 3 80 39 49 4 90 56 66 5 100 75 85 6 110 96 106 7 120 119 129 Does each of these firms experience economies of scale or diseconomies of scale? Explain your answer with necessary calculations.arrow_forward

