
(VAR.P and STDEV.P) Choose two well-known stocks and download the latest 61 months of adjusted prices from finance.yahoo.com. Calculate the monthly returns for each stock. Now find the variance and standard deviation of the returns for each stock by using VAR.P and STDEV.P. Annualize the variance by multiplying by 12 and the standard deviation by multiplying by the square root of 12.
To determine: The variance and standard deviation of two stocks.
Answer to Problem 1SQ
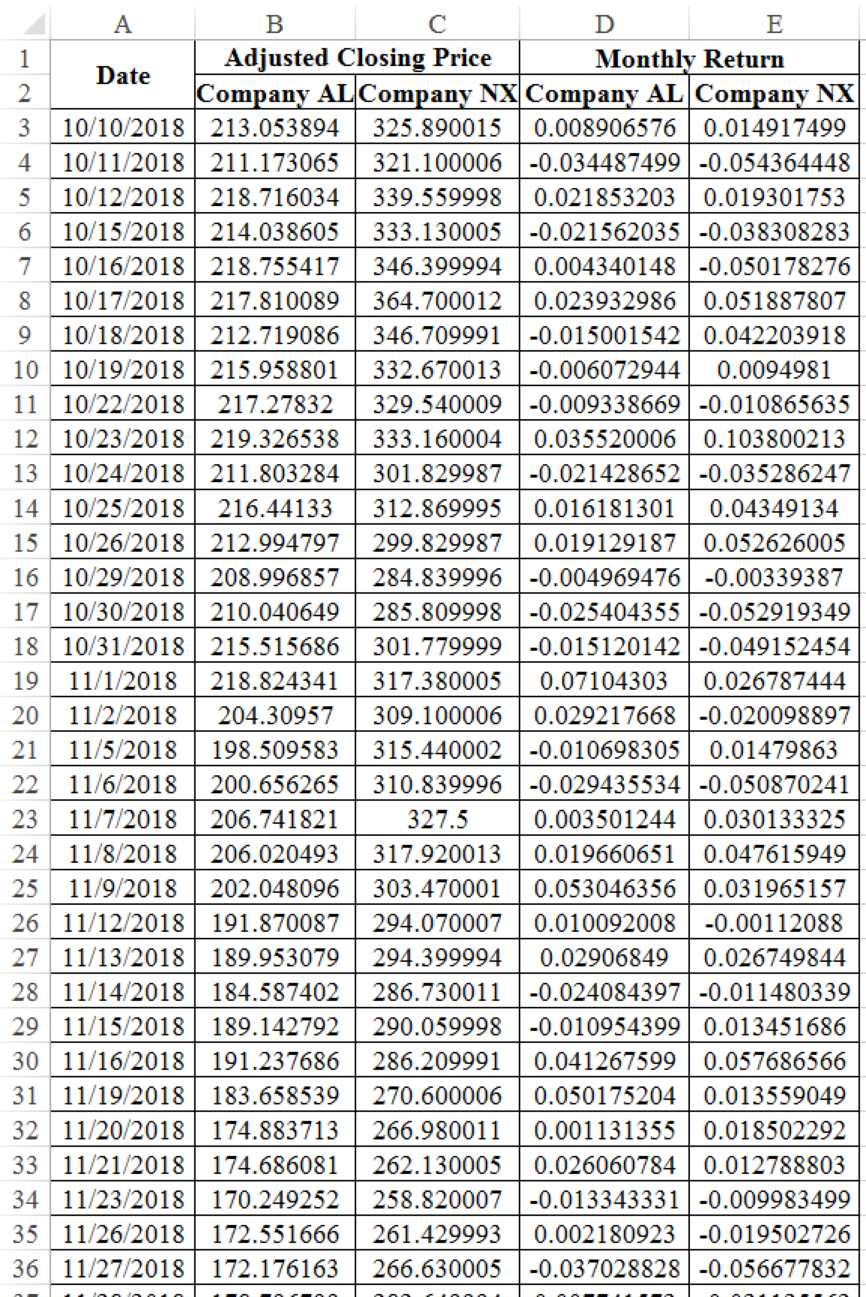
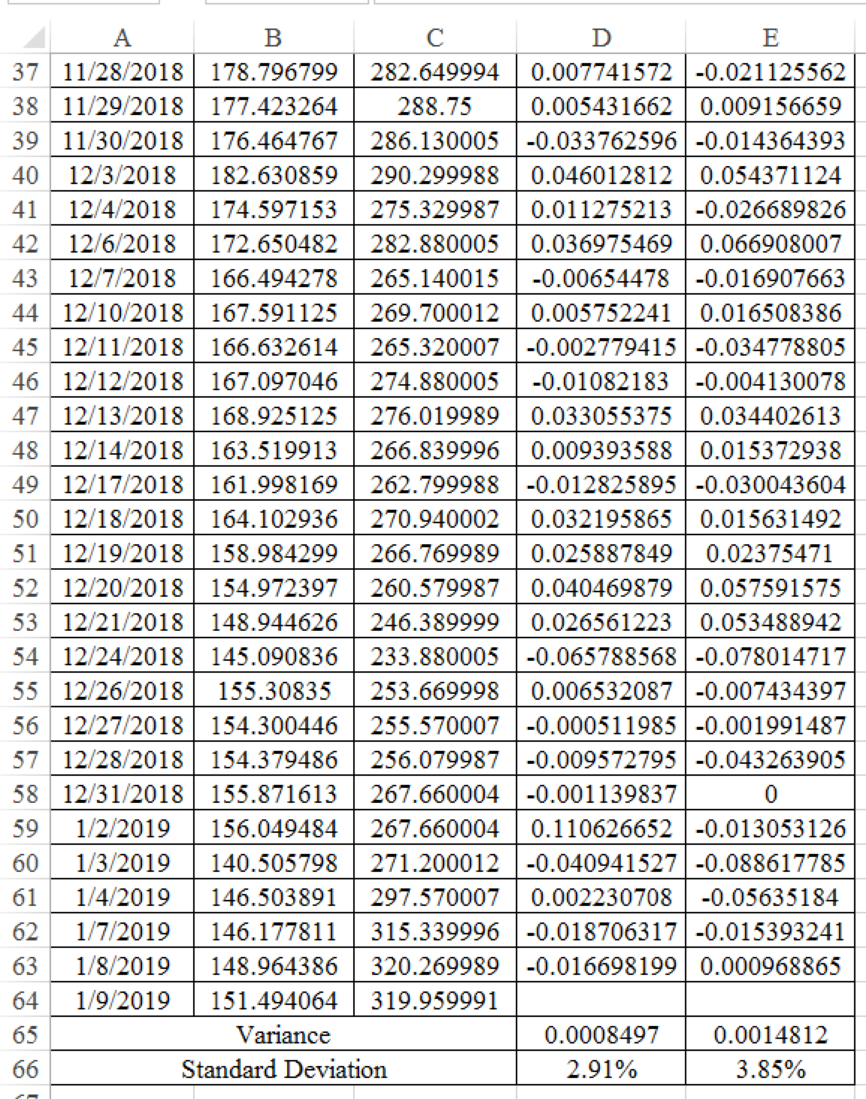
Company AL’s variance is 0.0008497 and standard deviation is 2.91%. Company NX’s variance is 0.0014812 and standard deviation is 3.85%.
Explanation of Solution
Determine the variance and standard deviation of Company AL
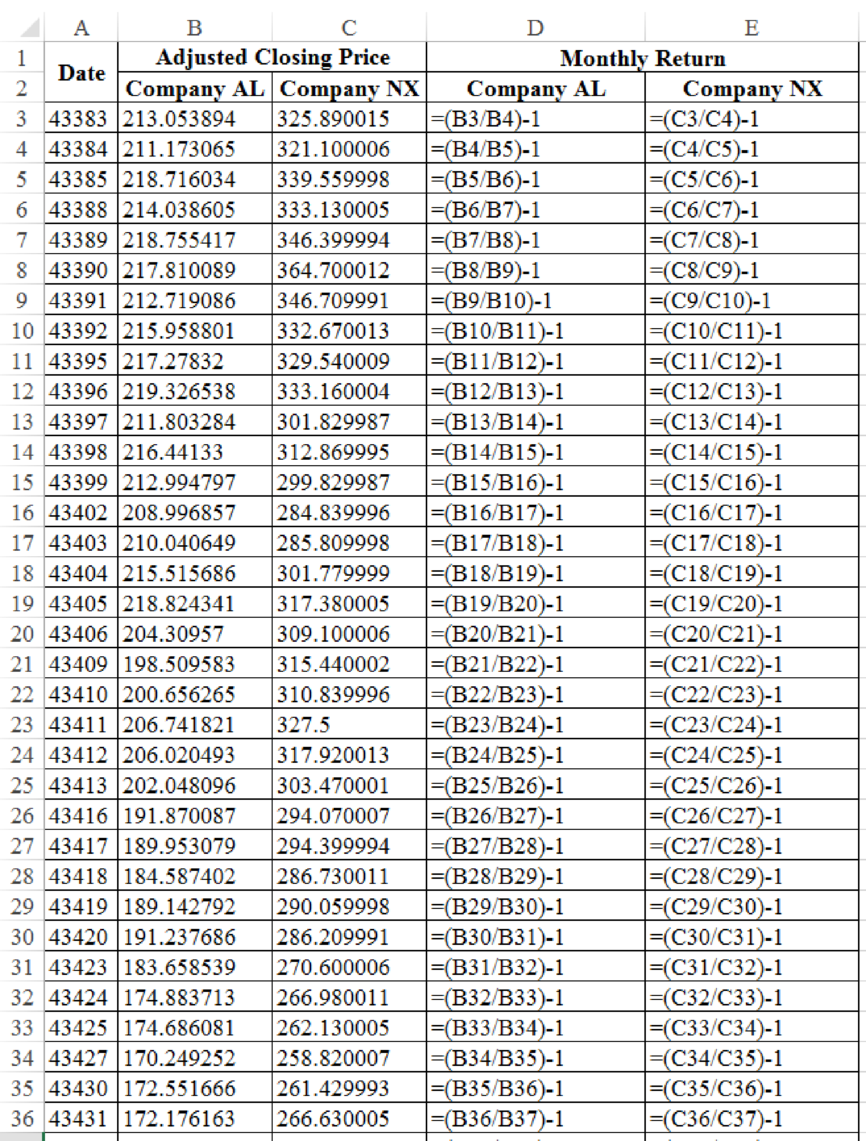
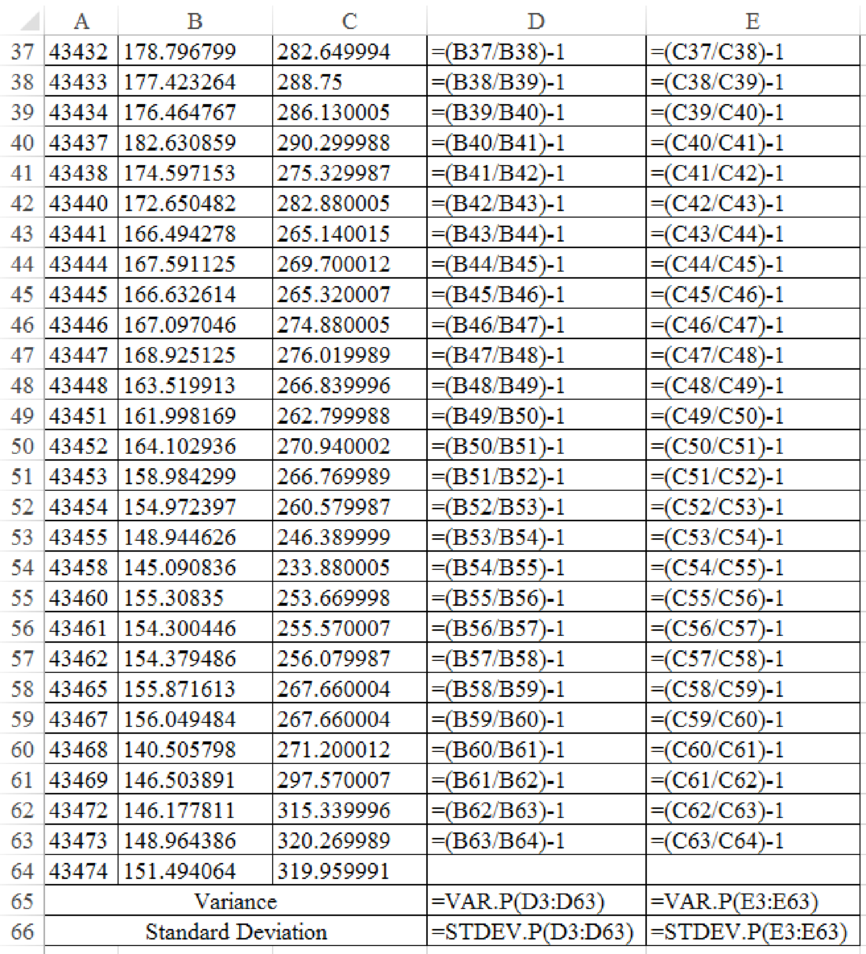
Excel Spreadsheet:
Excel Workings:
Therefore the Company AL’s variance is 0.0008497 and standard deviation is 2.91%. Company NX’s variance is 0.0014812 and standard deviation is 3.85%.
Want to see more full solutions like this?
Chapter 9 Solutions
PRIN.OF CORPORATE FINANCE
Additional Business Textbook Solutions
Gitman: Principl Manageri Finance_15 (15th Edition) (What's New in Finance)
Corporate Finance (4th Edition) (Pearson Series in Finance) - Standalone book
Corporate Finance (The Mcgraw-hill/Irwin Series in Finance, Insurance, and Real Estate)
Essentials of Corporate Finance (Mcgraw-hill/Irwin Series in Finance, Insurance, and Real Estate)
Fundamentals of Corporate Finance

- An analyst gathered daily stock returns for Feburary 1 through March 31, calculated the Fama-French factors for each day in the sample (SMBt and HMLt), and estimated the Fama-French regression model shown in Equation 6-21. The estimated coefficients were ai = 0, bi = 1.2, ci = 0.4, and di = 1.3. On April 1, the market return was 10%, the return on the SMB portfolio (rSMB) was 3.2%, and the return on the HML portfolio (rHML) was 4.8%. Using the estimated model, what was the stocks predicted return for April 1?arrow_forwardFor the Hawkins Company, the monthly percentages of all shipments received on time over the past 12 months are 80, 82, 84, 83, 83, 84, 85, 84, 82, 83, 84, and 83. Construct a time series plot. What type of pattern exists in the data? Compare a three-month moving average forecast with an exponential smoothing forecast for α = 0.2. Which provides the better forecasts using MSE as the measure of model accuracy? What is the forecast for next month?arrow_forwardThe following shows the expected percentage returns on three stocks over the next six years: Stock Percentage Return (%) Year 1 2 3 4 5 6 A 10 5 6 8 12 15 B 8 4 4.8 6.4 9.6 12 C 5 10 12 10 6 6 Required: i Find the expected return for each of the stock. ii Compute the variance and standard deviation for stock A, B and C. Show your working. iii Justify how can you minimize the risk of the above combination of stocks.arrow_forward
- The following shows the expected percentage returns on three stocks over the next six years:Stock Percentage Return (%)Year 1 2 3 4 5 6A 10 5 6 8 12 15B 8 4 4. 80 6.4 9.6 12C 5 10 12 10 6 6 Required:(i) Find the expected return for each of the stock.(ii) Compute the variance and standard deviation for stock A, B and C. Show your working.(iii) Justify how can you minimize the risk of the above combination of stocks. (Must show working method as well)arrow_forwardThe following are the monthly rates of return for Madison Cookies and for Sophie Electric during a six-month period. Month Madison Cookies Sophie Electric 1 -0.04 0.07 2 0.06 -0.02 3 -0.07 -0.10 4 0.12 0.15 5 -0.02 -0.06 6 0.05 0.02 Compute the following: a. Average monthly rate of return, Ri, for each stock b. Standard deviation of returns for each stock c. Covariance between the rates of return d. The correlation coefficient between the rates of return What level of correlation would you have expected before performing your calculations? How did your expectations compare with the computed correlation? Would these two stocks be good choices for diversification? Why or why not?arrow_forward. please with proper formula.You find a particular stock has an annual standard deviation of 55 percent. What is the standard deviation for a two-month period? O 23.10% O 24.50% O 22.45% O 21.05%arrow_forward
- You’ve observed the following returns on Yasmin Corporation’s stock over the past five years: 15 percent, –6 percent, 18 percent, 14 percent, and 10 percent. calculate the mean, variance and standard deviation without using Microsoft excel.arrow_forwardPlease solve using Excel and show formulas. Here are the percentage returns on two stocks. Month Digital Cheese Executive Fruit January 15 % 7 % February –4 2 March 5 5 April 7 13 May –5 1 June 3 5 July –3 –3 August –9 –1 a-1. Calculate the monthly variance and standard deviation of each stock. (Do not round intermediate calculations. Round your answers to 1 decimal places.) b. Now calculate the variance and standard deviation of the returns on a portfolio that invests an equal amount each month in the two stocks. (Do not round intermediate calculations. Round your answers to 1 decimal places.) c. Is the variance more or less than half way between the variance of the two individual stocks? multiple choice more than the 50%-50%Not attempted less than the 50%-50%Not attemptedarrow_forwardThe following are the monthly rates of return for Madison Cookies and for Sophie Electric during a six-month period. Month Madison Cookies Sophie Electric 1 -0.04 0.07 2 0.06 -0.02 3 -0.07 -0.10 4 0.12 0.15 5 -0.02 -0.06 6 0.05 0.02 Compute the following: a) Average monthly rate of return for each stock b) Standard deviation of returns for each stock c) Covariance between the rates of returns d) The correlation coefficient between the rates of return e) What level of correlation would you have expected before performing your calculations? f) How did your expectations compare with the computed correlation? g) Would these two stocks be good choices for diversification? Why or why not?arrow_forward
- During the past 5-year, the monthly average return and standard deviation of Netflix (NFLX) stock were 3.5% and 10%, respectively. For the same period, the monthly average return and standard deviation of Verizon (VZ) were 0.6% and 4.6%, respectively. The correlation between NFLX and VZ was -0.1. Assume that the monthly risk-free rate is 0.1%. ) What is the Sharpe ratio for NFLX? What is the Sharpe ratio for VZ? Show your calculation steps briefly and clearly. Find the minimum-variance portfolio (MVP), i.e., the weight of NFLX and VZ in the MVP. You do not need to show your calculation steps for this subquestion. Find the optimal risky portfolio P*, i.e., the weight of NFLX and VZ in P*. You do not need to show your calculation steps for this subquestion. Calculate the Sharpe ratio for the optimal risky portfolio P*. Verify that P* offers a higher Sharpe ratio than NFLX and VZ.arrow_forwardConsider the following annual returns of Molson Coors and International Paper: Molson Coors International Paper Year 1 23.8 % 6.0 % Year 2 − 9.9 −19.0 Year 3 44.0 −0.8 Year 4 − 9.9 28.1 Year 5 17.7 −12.6 Compute each stock’s average return, standard deviation, and coefficient of variation. (Round your answers to 2 decimal places.)arrow_forwardWe have 50 years of annual data on (detrended) ex post prices P∗ t and on (detrended) actual stock prices Pt . We find that the sample variances (svar) are as follows: svar(P∗ t ) = 120 and svar(Pt) = 80. What does this tell us and why?arrow_forward
 Essentials of Business Analytics (MindTap Course ...StatisticsISBN:9781305627734Author:Jeffrey D. Camm, James J. Cochran, Michael J. Fry, Jeffrey W. Ohlmann, David R. AndersonPublisher:Cengage Learning