
PRIN.OF CORPORATE FINANCE
13th Edition
ISBN: 9781260013900
Author: BREALEY
Publisher: RENT MCG
expand_more
expand_more
format_list_bulleted
Concept explainers
Videos
Textbook Question
Chapter 9, Problem 11PS
Measuring risk* The following table shows estimates of the risk of two well-known Canadian stocks:
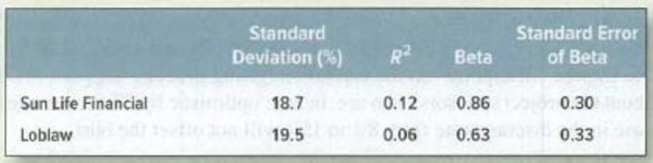
- a. What proportion of each stock’s risk was market risk, and what proportion was specific risk?
- b. What is the variance of the returns for Sun Life Financial stock? What is the specific variance?
- c. What is the confidence interval on Loblaw’s beta? (See page 234 for a definition of “confidence interval.”)
- d. If the
CAPM is correct, what is the expected return on Sun Life? Assume a risk-free interest rate of 5% and an expected market return of 12%. - e. Suppose that next year, the market provides a 20% return. Knowing this, what return would you expect from Sun Life?
Expert Solution & Answer
Want to see the full answer?
Check out a sample textbook solution
Students have asked these similar questions
Exercises:
a. The standard deviation of returns is 0.30 for Stock A and 0.20 for Stock B. The covariance between
the returns of A and B is 0.006. The correlation of returns between A and B is:
b. Explain the differences between systemic risk and unsystematic risk, give additional examples
c. Compare and contrast the Capital Market Line and Security Market Line
d.
The covariance of the market's returns with the stock's returns is 0.008. The standard deviation of
the market's returns is 0.08, and the standard deviation of the stock's returns is 0. 11. What is the
correlation coefficient of the returns of the stock and the returns of the market?
e. According to the CAPM, what is the required rate of return for a stock with a beta of 0.7, when the
risk-free rate is 7% and the expected market rate of return is 14%
When working with the CAPM, which of the following factors can be determined with the most precision?
a. The beta coefficient of "the market," which is the same as the beta of an average stock.
b. The beta coefficient, bi, of a relatively safe stock.
c. The market risk premium (RPM).
d. The most appropriate risk-free rate, rRF.
e. The expected rate of return on the market, rM.
When working with the CAPM, which of the following factors can be determined with the most precision?
a. The most appropriate risk-free rate, rRF.
b. The market risk premium (RPM).
c. The beta coefficient, bi, of a relatively safe stock.
d. The expected rate of return on the market, rM.
e. The beta coefficient of "the market," which is the same as the beta of an average stock.
Chapter 9 Solutions
PRIN.OF CORPORATE FINANCE
Ch. 9 - (VAR.P and STDEV.P) Choose two well-known stocks...Ch. 9 - (AVERAGE, VAR.P and STDEV.P) Now calculate the...Ch. 9 - (SLOPE) Download the Standard Poors index for the...Ch. 9 - Definitions Define the following terms: a. Cost of...Ch. 9 - True/false True or false? a. The company cost of...Ch. 9 - Company cost of capital Quark Productions (Give...Ch. 9 - Company cost of capital The total market value of...Ch. 9 - Company cost of capital You are given the...Ch. 9 - Company cost of capital Nero Violins has the...Ch. 9 - WACC A company is 40% financed by risk-free debt....
Ch. 9 - WACC Binomial Tree Farms financing includes 5...Ch. 9 - Prob. 10PSCh. 9 - Measuring risk The following table shows estimates...Ch. 9 - Prob. 12PSCh. 9 - Asset betas Which of these projects is likely to...Ch. 9 - Asset betas EZCUBE Corp. is 50% financed with...Ch. 9 - Prob. 15PSCh. 9 - Prob. 16PSCh. 9 - Prob. 17PSCh. 9 - Fudge factors John Barleycorn estimates his firms...Ch. 9 - Prob. 19PSCh. 9 - Prob. 20PSCh. 9 - Certainty equivalents A project has a forecasted...Ch. 9 - Certainty equivalents A project has the following...Ch. 9 - Prob. 23PSCh. 9 - Beta of costs Suppose that you are valuing a...Ch. 9 - Fudge factors An oil company executive is...
Knowledge Booster


Learn more about
Need a deep-dive on the concept behind this application? Look no further. Learn more about this topic, finance and related others by exploring similar questions and additional content below.Similar questions
- (Expected rate of return and risk) Syntex, Inc. is considering an investment in one of two common stocks. Given the information that follows, which investment is better, based on the risk (as measured by the standard deviation) and return? Common Stock A Probability 0.20 0.60 0.20 Probability 0.15 0.35 0.35 0.15 (Click on the icon in order to copy its contents into a spreadsheet.) Common Stock B Return 13% 14% 18% Return - 6% 7% 15% 21% a. Given the information in the table, the expected rate of return for stock A is 14.6 %. (Round to two decimal places.) The standard deviation of stock A is %. (Round to two decimal places.)arrow_forwarda. Determine Stock X's beta coefficient. b. Determine the arithmetic average rates of return for Stock X and the NYSE over the period given. Calculate the standard deviations of returns for both Stock X and the NYSE. c. Assume that the required return on equity, re, for Stock X is equal to its average return. Likewise, assume that the market return is equal to the NYSE's average return. Using the information calculated, what is the assumed risk-free rate in the CAPM equation? Hint: Solve algebraically for rf in, re = r¡ + B(rm – r;)arrow_forwardThe following table shows estimates of the risk of two well-known Canadian stocks: Standard Deviation (%) R2raise to the power of 2 Beta Standard Error of Beta Sun Life Financial 25.7 0.19 0.93 0.12 Suncor Energy 26.5 0.02 0.70 0.27 What proportion of each stock’s risk was market risk, and what proportion was specific risk? What is the variance of the returns for Sun Life Financial stock? What is the specific variance? What is the confidence interval on Suncor’s beta? If the CAPM is correct, what is the expected return on Sun Life? Assume a risk-free interest rate of 4% and an expected market return of 14%. Suppose that next year, the market provides a 14% return. Knowing this, what return would you expect from Sun Life?arrow_forward
- K (Expected rate of return and risk) Syntex, Inc. is considering an investment in one of two common stocks. Given the information that follows, which investment is better, based on the risk (as measured by the standard deviation) and return? Common Stock A Probability 0.20 0.60 0.20 Common Stock B Return 13% 17% 18% Probability 0.10 0.40 0.40 0.10 (Click on the icon in order to copy its contents into a spreadsheet.) Return -7% 5% 16% 21% www a. Given the information in the table, the expected rate of return for stock A is 16.40 %. (Round to two decimal places.) The standard deviation of stock A is 1.74 %. (Round to two decimal places.) b. The expected rate of return for stock B is 9.8 %. (Round to two decimal places.) The standard deviation for stock B is 6.12 %. (Round to two decimal places.)arrow_forward(Expected rate of return and risk) Syntex, Inc. is considering an investment in one of two common stocks. Given the information that follows, which investment is better, based on the risk (as measured by the standard deviation) and return? Common Stock A Probability 0.25 0,50 0.25 Probability 0.10 0.40 0.40 0.10 (Click on the icon in order to copy its contents into a apreadsheet) Common Stock B Return 10% 17% 18% Return -4% 7% 13% 20% G a. Given the information in the table, the expected rate of return for stock A is 15.5% (Round to two decimal places) The standard deviation of stock A is (Round to two decimal places.)arrow_forwardSyntex, Inc. is considering an investment in one of two common stocks. Given the information that follows, which investment is better, based on the risk (as measured by the standard deviation) and return? Common Stock A Common Stock B Probability Return Probability Return 0.25 13% 0.25 −7% 0.50 14% 0.25 7% 0.25 18% 0.25 16% 0.25 23% (Click on the icon in order to copy its contents into a spreadsheet.) Question content area bottom Part 1 a. Given the information in the table, the expected rate of return for stock A is enter your response here %. (Round to two decimal places.) Part 2 The standard deviation of stock A is enter your response here %. (Round to two decimal places.) Part 3 b. The expected rate of return for stock B is enter your response here %. (Round to two decimal places.) Part 4 The standard deviation for stock B is enter…arrow_forward
- Syntex, Inc. is considering an investment in one of two common stocks. Given the information that follows, which investment is better, based on the risk (as measured by the standard deviation) and return? Common Stock A Common Stock B Probability Return Probability Return 0.35 13% 0.25 −7% 0.30 17% 0.25 8% 0.35 21% 0.25 15% 0.25 23% (Click on the icon in order to copy its contents into a spreadsheet.) Question content area bottom Part 1 a. Given the information in the table, the expected rate of return for stock A is enter your response here%. (Round to two decimal places.)arrow_forwardThe following table shows estimates of the risk of two well-known Canadian stocks: Standard Standard Deviation (%) R2 Beta Error of Beta Sun Life Financial 25.7 0.19 0.95 0.16 Loblaw 30.5 0.01 0.21 0.27 What proportion of each stock’s risk was market risk, and what proportion was specific risk? What is the variance of the returns for Sun Life Financial stock? What is the specific variance? What is the confidence interval on Loblaw's beta? If the CAPM is correct, what is the expected return on Sun Life? Assume a risk-free interest rate of 4% and an expected market return of 13%. Suppose that next year, the market provides a 18% return. Knowing this, what return would you expect from Sun Life?arrow_forwarda. Calculate the expected return for Stock media Prima and Stock Astro 2. Calculate the standard deviation for Stock media Prima and Stock Astro 3. Calculate the covariance and correlation of coefficient for the above stock.arrow_forward
- (Expected rate of return and risk) Syntex, Inc. is considering an investment in one of two common stocks. Given the information that follows, which investment is better, based on the risk (as measured by the standard deviation) and return? Common Stock A Probability 0.20 0.60 0.20 Probability 0.15 0.35 0.35 0.15 (Click on the icon in order to copy its contents into a spreadsheet.) ew an example Get more help. T 3 a. Given the information in the table, the expected rate of retum for stock A is 15.6 %. (Round to two decimal places.) The standard deviation of stock A is %. (Round to two decimal places.) E D 80 73 Return. 12% 16% 18% U с $ 4 R F 288 F4 V Common Stock B % 5 T FS G 6 Return -7% 7% 13% 21% B MacBook Air 2 F& Y H & 7 N 44 F? U J ** 8 M | MOSISO ( 9 K DD O . Clear all : ; y 4 FIX { option [ + = ? 1 Check answer . FV2 } ◄ 1 delete 1 return shiftarrow_forward(c) Consider information given in the table below and answers the question asked thereafter: i. Calculate expected return on each stock? On the basis of this measure, which stock you will choose?ii. Calculate standard deviation of the returns on each stock? On the basis of this measure, which stock you will choose?iii. Calculate coefficient of variance of the returns on each stock? On the basis of this measure, which stock you will choose?iv. Calculate covariance and coefficient of correlation between the returns of the stocks A and B.v. Now suppose you have $100,000 to invest and you want to a hold a portfolio comprising of $35,000 invested in stock A and remaining amount in stock B. Calculate risk and return of your portfolio. (d) Firm A reports a Profit Margin of 6.5% and a Total Asset Turnover Ratio of 3.25. Their total asset level is $8,500,000. Assume there are 700,000 shares outstanding and the PE ratio is 11. Also, assume the Return on Equity is 16%. Based on this, calculate…arrow_forwardQ1: Explain the meaning and significance of a stock's beta coefficient. Illustrate your explanation by drawing, on one graph, the characteristic lines for stocks with low, average, and high risk. (Hint: Let your three characteristic lines intersect at r_i=r_m=6%, the assumed risk-free rate.) Q2: Define the following terms, using graphs or equations to illustrate your answers where feasible. a) Risk, stand-alone risk b) Expected rate of return c) standard deviation, variance d) risk premium for stock i, market risk premium e) Capital Asset Pricing Model (CAPM) f) Expected return on a portfolio g) market risk, diversifiable risk h) Beta i) Security Market Line; SML equation j) Slope of SML and its relationship to risk aversion. Q3. Differentiate between (a) stand-alone risk and (b) risk in a portfolio context. How are they measured, and are both concepts relevant for investors? Q4. Can an investor eliminate market risk from a portfolio of common stocks? How many stocks must a portfolio…arrow_forward
arrow_back_ios
SEE MORE QUESTIONS
arrow_forward_ios
Recommended textbooks for you
 EBK CONTEMPORARY FINANCIAL MANAGEMENTFinanceISBN:9781337514835Author:MOYERPublisher:CENGAGE LEARNING - CONSIGNMENT
 Intermediate Financial Management (MindTap Course...FinanceISBN:9781337395083Author:Eugene F. Brigham, Phillip R. DavesPublisher:Cengage Learning
EBK CONTEMPORARY FINANCIAL MANAGEMENT
Finance
ISBN:9781337514835
Author:MOYER
Publisher:CENGAGE LEARNING - CONSIGNMENT
Intermediate Financial Management (MindTap Course...
Finance
ISBN:9781337395083
Author:Eugene F. Brigham, Phillip R. Daves
Publisher:Cengage Learning
Portfolio Management; Author: DevTechFinance;https://www.youtube.com/watch?v=Qmw15cG2Mv4;License: Standard YouTube License, CC-BY