
Concept explainers
Videos
(a)
To find: the number of unemployed workers in the 16-19 age group.
(a)
Answer to Problem 58E
The number of unemployed workers is 1.3752 millions.
Explanation of Solution
Given information:
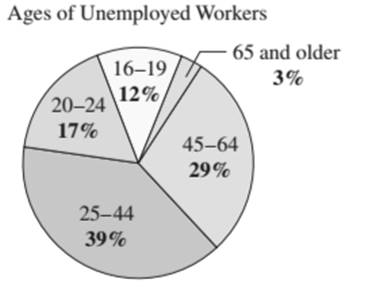
In 2013, there were approximately 11.46 million unemployed workers in the U.S. The circle graph shows the age profit of these unemployed workers.
Given graph:

Calculation:
Here, the percentage for 16-19 age group is 12%.
The number of unemployed workers is:
(b)
To find: the number of unemployed workers who are 45 years or older.
(b)
Answer to Problem 58E
The number of unemployed workers is 3.3234 millions.
Explanation of Solution
Given information:
In 2013, there were approximately 11.46 million unemployed workers in the U.S. The circle graph shows the age profit of these unemployed workers.
Given graph:

Calculation:
Here, the percentage for 45-46 age group is 29%.
The number of unemployed workers is:
(c)
To find: the probability that a person selected at random from the population of unemployed workers is in the 25-44 age group.
(c)
Answer to Problem 58E
The probability is 0.39.
Explanation of Solution
Given information:
In 2013, there were approximately 11.46 million unemployed workers in the U.S. The circle graph shows the age profit of these unemployed workers.
Given graph:

Calculation:
Here, the percentage for 25-44 age group is 39%.
The number of unemployed workers is:
Hence, the probability is:
(d)
To find: the probability that a person selected at random from the population of unemployed workers is in the 25-64 years old.
(d)
Answer to Problem 58E
The probability is 0.68.
Explanation of Solution
Given information:
In 2013, there were approximately 11.46 million unemployed workers in the U.S. The circle graph shows the age profit of these unemployed workers.
Given graph:
Calculation:
Here, the percentage for 25-64 age group is
The number of unemployed workers is:
Hence, the probability is:
(e)
To find: the probability that a person selected at random from the population of unemployed workers is 45 or older.
(e)
Answer to Problem 58E
The probability is 0.29.
Explanation of Solution
Given information:
In 2013, there were approximately 11.46 million unemployed workers in the U.S. The circle graph shows the age profit of these unemployed workers.
Given graph:

Calculation:
The number of unemployed workers above age is: 3.3234 millions.
Hence, the probability is:
Chapter 8 Solutions
Precalculus with Limits: A Graphing Approach


 Calculus: Early TranscendentalsCalculusISBN:9781285741550Author:James StewartPublisher:Cengage Learning
 Thomas' Calculus (14th Edition)CalculusISBN:9780134438986Author:Joel R. Hass, Christopher E. Heil, Maurice D. WeirPublisher:PEARSON
 Calculus: Early Transcendentals (3rd Edition)CalculusISBN:9780134763644Author:William L. Briggs, Lyle Cochran, Bernard Gillett, Eric SchulzPublisher:PEARSON
 Calculus: Early TranscendentalsCalculusISBN:9781319050740Author:Jon Rogawski, Colin Adams, Robert FranzosaPublisher:W. H. Freeman
 Calculus: Early Transcendental FunctionsCalculusISBN:9781337552516Author:Ron Larson, Bruce H. EdwardsPublisher:Cengage Learning