
Concept explainers
Videos
Housing for Sale The following graph shows the number of housing starts for sale purposes in the United States during 2000–2008 together with a quadratic approximating model:
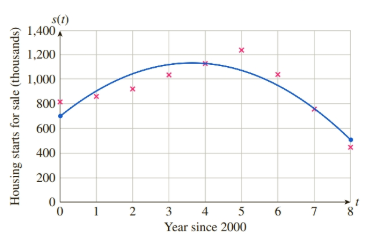
(t is the time in years since 2000.)5 At the same time, the homes being built were getting larger: The average area per home was approximately
Use the given models to estimate the total housing area under construction over the given period. (Use
Want to see the full answer?
Check out a sample textbook solution
Chapter 7 Solutions
Applied Calculus


- The figure shows the graphs of the cost and revenue functions for a company that manufactures and sells small radios. Use the information in the figure to solve Exercises 67–72. 35,000 30,000 C(x) = 10,000 + 30x 25,000 20,000 15,000 R(x) = 50x 10,000 5000 100 200 300 400 500 600 700 Radios Produced and Sold 67. How many radios must be produced and sold for the company to break even? 68. More than how many radios must be produced and sold for the company to have a profit? 69. Use the formulas shown in the voice balloons to find R(200) – C(200). Describe what this means for the company. 70. Use the formulas shown in the voice balloons to find R(300) – C(300). Describe what this means for the company. 71. a. Use the formulas shown in the voice balloons to write the company's profit function, P, from producing and selling x radios. b. Find the company's profit if 10,000 radios are produced and sold. 72. a. Use the formulas shown in the voice balloons to write the company's profit function,…arrow_forwardAmerica is getting older. The graph shows the projected elderly U.S. population for ages 65–84 and for ages 85 and older.The formula E = 5.8√x + 56.4 models the projected number of elderly Americans ages 65–84, E, in millions, x years after 2020.a. Use the formula to find the projected increase in the number of Americans ages 65–84, in millions, from 2030 to 2060. Express this difference in simplified radicalform.b. Use a calculator and write your answer in part (a) to the nearest tenth. Does this rounded decimal overestimate or underestimate the difference in the projected data shown by the bar graph ? By how much?arrow_forwardThe following graph shows the annual number of housing starts in a country during 2000–2008 together with the given quadratic approximating model. s(t) = −30t2 + 240t + 800 thousand homes per year (See attached graph) (t is the time in years since 2000.) At the same time, the homes being built were getting larger: The average area per home is approximately given by the following function. a(t) = 90t + 6,000 square feet Use the given models to estimate the total housing area under construction over the given period. (Use integration by parts to evaluate the integral, and round your answer to the nearest billion square feet.) HINT [Rate of change of area under construction = s(t)a(t).] ____________ billion square feetarrow_forward
- Insurance Rates The following table gives themonthly insurance rates for a $100,000 life insurancepolicy for smokers 35–50 years of age.a. Create a scatter plot for the data.b. Does it appear that a quadratic function can beused to model the data? If so, find the best-fittingquadratic model.c. Find the power model that is the best fit for the data.d. Compare the two models by graphing each modelon the same axes with the data points. Whichmodel appears to be the better fit?arrow_forwardWorld Military Expenditure The following chart shows total military and arms trade expenditure from 2011–2020 (t = 1 represents 2011). †A bar graph titled "World military expenditure" has a horizontal t-axis labeled "Year since 2010" and a vertical axis labeled "$ (billions)". The bar graph has 10 bars. Each bar is associated with a label and an approximate value as listed below. 1: 1,800 billion dollars 2: 1,775 billion dollars 3: 1,750 billion dollars 4: 1,730 billion dollars 5: 1,760 billion dollars 6: 1,760 billion dollars 7: 1,850 billion dollars 8: 1,900 billion dollars 9: 1,950 billion dollars 10: 1,980 billion dollars (a) If you want to model the expenditure figures with a function of the form f(t) = at2 + bt + c, would you expect the coefficient a to be positive or negative? Why? HINT [See "Features of a Parabola" in this section.] We would expect the coefficient to be positive because the curve is concave up. We would expect the coefficient to be negative because the…arrow_forwardCell Phones Using the CTIA Wireless Survey for1985–2009, the number of U.S. cell phone subscribers (in millions) can be modeled byy = 0.632x2 - 2.651x + 1.209where x is the number of years after 1985.a. Graphically find when the number of U.S.subscribers was 301,617,000.b. When does the model estimate that the number ofU.S. subscribers would reach 359,515,000?c. What does the answer to (b) tell about this model?arrow_forward
 Algebra & Trigonometry with Analytic GeometryAlgebraISBN:9781133382119Author:SwokowskiPublisher:Cengage