
Concept explainers
Videos
Housing The following graph shows the annual number of housing starts in the United States during 2000–2008 together with a quadratic approximating model:
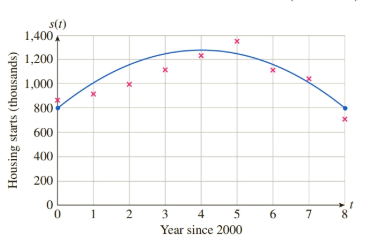
(t is the time in years since 2000.)4 At the same time, the homes being built were getting larger:
Use the given models to estimate the total housing area under construction over the given period. (Use
Want to see the full answer?
Check out a sample textbook solution
Chapter 7 Solutions
Applied Calculus


- America is getting older. The graph shows the projected elderly U.S. population for ages 65–84 and for ages 85 and older.The formula E = 5.8√x + 56.4 models the projected number of elderly Americans ages 65–84, E, in millions, x years after 2020.a. Use the formula to find the projected increase in the number of Americans ages 65–84, in millions, from 2030 to 2060. Express this difference in simplified radicalform.b. Use a calculator and write your answer in part (a) to the nearest tenth. Does this rounded decimal overestimate or underestimate the difference in the projected data shown by the bar graph ? By how much?arrow_forwardThe figure shows the graphs of the cost and revenue functions for a company that manufactures and sells small radios. Use the information in the figure to solve Exercises 67–72. 35,000 30,000 C(x) = 10,000 + 30x 25,000 20,000 15,000 R(x) = 50x 10,000 5000 100 200 300 400 500 600 700 Radios Produced and Sold 67. How many radios must be produced and sold for the company to break even? 68. More than how many radios must be produced and sold for the company to have a profit? 69. Use the formulas shown in the voice balloons to find R(200) – C(200). Describe what this means for the company. 70. Use the formulas shown in the voice balloons to find R(300) – C(300). Describe what this means for the company. 71. a. Use the formulas shown in the voice balloons to write the company's profit function, P, from producing and selling x radios. b. Find the company's profit if 10,000 radios are produced and sold. 72. a. Use the formulas shown in the voice balloons to write the company's profit function,…arrow_forwardCell Phones Using the CTIA Wireless Survey for1985–2009, the number of U.S. cell phone subscribers (in millions) can be modeled byy = 0.632x2 - 2.651x + 1.209where x is the number of years after 1985.a. Graphically find when the number of U.S.subscribers was 301,617,000.b. When does the model estimate that the number ofU.S. subscribers would reach 359,515,000?c. What does the answer to (b) tell about this model?arrow_forward
- Insurance Rates The following table gives themonthly insurance rates for a $100,000 life insurancepolicy for smokers 35–50 years of age.a. Create a scatter plot for the data.b. Does it appear that a quadratic function can beused to model the data? If so, find the best-fittingquadratic model.c. Find the power model that is the best fit for the data.d. Compare the two models by graphing each modelon the same axes with the data points. Whichmodel appears to be the better fit?arrow_forwardIn Exercises 61–64, find an equation for the level surface of the function through the given point.arrow_forwardSec3.4#55arrow_forward
- In Exercises 7–12, describe the relationship between the two quantities.arrow_forwardthe population P (in millions) in Russian from 1996 to 2004 can be approximated by the model P=152.26e-0.00039t where t=6 represents the year 1996. using the model, and without doing any calculations. answer the following question. would the population of Russian be increasing or decreasing during the given time period? explain.arrow_forward
 Algebra & Trigonometry with Analytic GeometryAlgebraISBN:9781133382119Author:SwokowskiPublisher:Cengage