
Videos
a.
To find: does the function represent exponential growth or exponential decay, explain.
a.
Answer to Problem 11Q
The function represents exponential growth because the base 4 > 1.
Explanation of Solution
Given information: The function
after t years.
Calculation:
Given the function:
The function represents exponential growth because the base 4 > 1.
b.
To graph: the function and describe the domain and range.
b.
Answer to Problem 11Q
The domain is
The range is
Explanation of Solution
Given information: The function
after t years.
Calculation:
Given the function:
Make a table of values:
| t | f(t) |
| 0 | 5 |
| 1 | 20 |
| 2 | 80 |
| 3 | 320 |
| 4 | 1280 |
| 5 | 5120 |
| 6 | 20,480 |
Graph the function
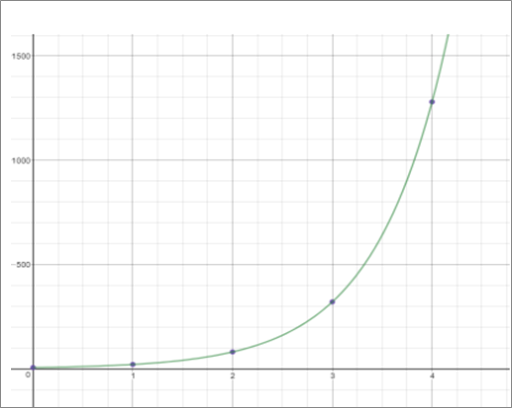
The domain is
The range is
c.
To find: what is the yearly percent change.
c.
Answer to Problem 11Q
The yearly percent change
Explanation of Solution
Given information: The function
after t years.
Calculation:
To find yearly percent change:
d.
To find: how many frogs are in the pond after
d.
Answer to Problem 11Q
1280 frogs are in the pond after 4 years.
Explanation of Solution
Given information: The function
after t years.
Calculation:
Have to find f(t) for t =4:
Chapter 6 Solutions
BIG IDEAS MATH Integrated Math 1: Student Edition 2016


 Discrete Mathematics and Its Applications ( 8th I...MathISBN:9781259676512Author:Kenneth H RosenPublisher:McGraw-Hill Education
 Mathematics for Elementary Teachers with Activiti...MathISBN:9780134392790Author:Beckmann, SybillaPublisher:PEARSON
 Thinking Mathematically (7th Edition)MathISBN:9780134683713Author:Robert F. BlitzerPublisher:PEARSON
 Discrete Mathematics With ApplicationsMathISBN:9781337694193Author:EPP, Susanna S.Publisher:Cengage Learning,
 Pathways To Math Literacy (looseleaf)MathISBN:9781259985607Author:David Sobecki Professor, Brian A. MercerPublisher:McGraw-Hill Education