
Videos
To graph: the function with the given description and compare the function to
Answer to Problem 44E
Both functions have the same value at x = 2 but the value of h is greater than the value of f over the rest of the interval.
Explanation of Solution
Given information: An exponential function h models a relationship in which the
dependent variable is multiplied by
Calculation:
Since (0, 32) is in the graph of h. To find points to the right of (0, 32), multiply h(x) by
Step 1: Make table of values
| x | 0 | 1 | 2 | 3 |
| h(x) | 32 | 16 | 8 | 4 |
Step 2: Plot the ordered pairs.
Step 3: Draw a smooth curve through the points.
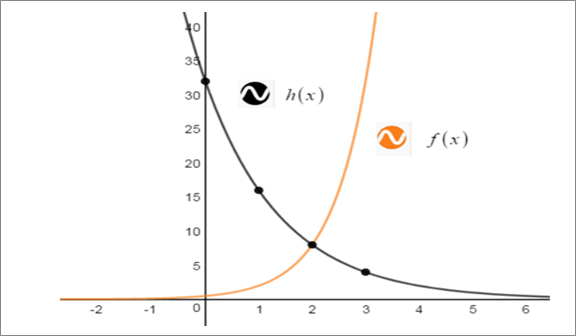
Both functions have the same value at x = 2 but the value of h is greater than the value of f over the rest of the interval.
Chapter 6 Solutions
BIG IDEAS MATH Integrated Math 1: Student Edition 2016


 Discrete Mathematics and Its Applications ( 8th I...MathISBN:9781259676512Author:Kenneth H RosenPublisher:McGraw-Hill Education
 Mathematics for Elementary Teachers with Activiti...MathISBN:9780134392790Author:Beckmann, SybillaPublisher:PEARSON
 Thinking Mathematically (7th Edition)MathISBN:9780134683713Author:Robert F. BlitzerPublisher:PEARSON
 Discrete Mathematics With ApplicationsMathISBN:9781337694193Author:EPP, Susanna S.Publisher:Cengage Learning,
 Pathways To Math Literacy (looseleaf)MathISBN:9781259985607Author:David Sobecki Professor, Brian A. MercerPublisher:McGraw-Hill Education