Foundations Of Finance
10th Edition
ISBN: 9780134897264
Author: KEOWN, Arthur J., Martin, John D., PETTY, J. William
Publisher: Pearson,
expand_more
expand_more
format_list_bulleted
Videos
Textbook Question
Chapter 6, Problem 4SP
(Expected
Expert Solution & Answer
Want to see the full answer?
Check out a sample textbook solution
Students have asked these similar questions
(Expected rate of return and risk) Syntex, Inc. is considering an investment in one of two common stocks. Given the information that follows, which investment is better, based on the risk (as
measured by the standard deviation) and return?
Common Stock A
Probability
0.20
0.60
0.20
Probability
0.15
0.35
0.35
0.15
(Click on the icon in order to copy its contents into a spreadsheet.)
ew an example Get more help.
T
3
a. Given the information in the table, the expected rate of retum for stock A is 15.6 %. (Round to two decimal places.)
The standard deviation of stock A is %. (Round to two decimal places.)
E
D
80
73
Return.
12%
16%
18%
U
с
$
4
R
F
288
F4
V
Common Stock B
%
5
T
FS
G
6
Return
-7%
7%
13%
21%
B
MacBook Air
2
F&
Y
H
&
7
N
44
F?
U
J
**
8
M
|
MOSISO
(
9
K
DD
O
.
Clear all
:
;
y
4
FIX
{
option
[
+
=
?
1
Check answer
.
FV2
}
◄
1
delete
1
return
shift
(Expected rate of return and risk) Syntex, Inc. is considering an investment in one of two common stocks Given the information that filloors, which investment is better based on the risk (as measured
by the standard deviation) and retum?
Common Stock A
Probability
0,20
0.60
0:20
Return
10%
17%
20%
Common Stock B
Probability
0.25
0.25
0.25
0.25
(Click on the icon in order to copy its contents into a spreadsheet)
Return
-6%
5%
16%
23%
a. Given the information in the table, the expected rate of retum for stock Ais (Round to two decimal places)
(Expected rate of return and risk) Syntex, Inc. is considering an investment in one of two common stocks. Given the
information that follows, which investment is better, based on the risk (as measured by the standard deviation)
and return?
Common Stock A
Probability
0.35
0.30
0.35
Return
13%
14%
18%
Common Stock B
Return
- 6%
7%
16%
20%
Probability
0.15
0.35
0.35
0.15
(Click on the icon in order to copy its contents into a spreadsheet.)
Chapter 6 Solutions
Foundations Of Finance
Ch. 6 - a. What is meant by the investors required rate of...Ch. 6 - Prob. 2RQCh. 6 - What is a beta? How is it used to calculate r, the...Ch. 6 - Prob. 4RQCh. 6 - Prob. 5RQCh. 6 - Prob. 6RQCh. 6 - Prob. 7RQCh. 6 - What effect will diversifying your portfolio have...Ch. 6 - (Expected return and risk) Universal Corporation...Ch. 6 - (Average expected return and risk) Given the...
Ch. 6 - (Expected rate of return and risk) Carter, Inc. is...Ch. 6 - (Expected rate of return and risk) Summerville,...Ch. 6 - Prob. 5SPCh. 6 - Prob. 9SPCh. 6 - Prob. 10SPCh. 6 - Prob. 11SPCh. 6 - Prob. 12SPCh. 6 - Prob. 14SPCh. 6 - (Capital asset pricing model) Using the CAPM,...Ch. 6 - Prob. 16SPCh. 6 - Prob. 17SPCh. 6 - a. Compute an appropriate rate of return for Intel...Ch. 6 - (Estimating beta) From the graph in the right...Ch. 6 - Prob. 20SPCh. 6 - Prob. 21SPCh. 6 - (Capital asset pricing model) The expected return...Ch. 6 - (Portfolio beta and security market line) You own...Ch. 6 - (Portfolio beta) Assume you have the following...Ch. 6 - Prob. 1MCCh. 6 - Prob. 2MCCh. 6 - Prob. 3MCCh. 6 - Prob. 4MCCh. 6 - Prob. 5MCCh. 6 - Prob. 6MCCh. 6 - Prob. 7MCCh. 6 - Prob. 8MCCh. 6 - Prob. 9MCCh. 6 - Prob. 10MCCh. 6 - Prob. 11MC
Knowledge Booster


Learn more about
Need a deep-dive on the concept behind this application? Look no further. Learn more about this topic, finance and related others by exploring similar questions and additional content below.Similar questions
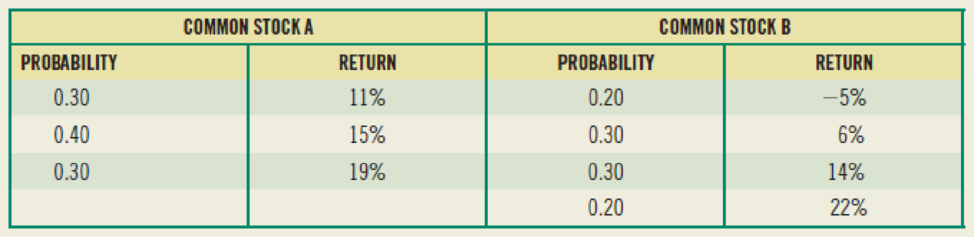
- Calculate the correlation coefficient between Blandy and the market. Use this and the previously calculated (or given) standard deviations of Blandy and the market to estimate Blandy’s beta. Does Blandy contribute more or less risk to a well-diversified portfolio than does the average stock? Use the SML to estimate Blandy’s required return.arrow_forwardWhen working with the CAPM, which of the following factors can be determined with the most precision? a. The beta coefficient of "the market," which is the same as the beta of an average stock. b. The beta coefficient, bi, of a relatively safe stock. c. The market risk premium (RPM). d. The most appropriate risk-free rate, rRF. e. The expected rate of return on the market, rM.arrow_forward(Expected rate of return and risk) Syntex, Inc. is considering an investment in one of two common stocks. Given the information that follows, which investment is better, based on the risk (as measured by the standard deviation) and return? Common Stock A Common Stock B Probability Return Probability Return0.20 10% 0.15 -4% 0.60 16% 0.35 7%0.20 21% 0.35 13% 0.15 20% a) Syntex, Inc. is considering an investment in one of two common stocks. Given the information that follows, what is the expected rate of return for stock A? What is the standard deviation? b. Syntex, Inc. is considering an investment in one of two common stocks. Given the information that follows, what is the expected rate of return for stock B? What is the standard deviation? c. Based on the risk (as measured by the standard deviation) and return of each stock, which…arrow_forward
- a. Determine Stock X's beta coefficient. b. Determine the arithmetic average rates of return for Stock X and the NYSE over the period given. Calculate the standard deviations of returns for both Stock X and the NYSE. c. Assume that the required return on equity, re, for Stock X is equal to its average return. Likewise, assume that the market return is equal to the NYSE's average return. Using the information calculated, what is the assumed risk-free rate in the CAPM equation? Hint: Solve algebraically for rf in, re = r¡ + B(rm – r;)arrow_forward(Expected rate of return and risk) Syntex, Inc is considering an investment in one of two common stocks Given the information that follows, which investment is better, based on the risk (as measured by the standard deviation) and retum? Common Stock A Probability 0.25 0,50 0:25 Common Stock B Return 10% 17% 10% Probability 0.10 0:40 0:40 010 (Click on the soon in order to copy its contents into a spreadsheet) Return -6% 8% 15% 20% COD a. Given the information in the table the expected rate of return for stock A is 15.5% (Round to two decimal places) The standard deviation of stock A is 4 36% (Round to two decimal places)arrow_forward(c) Consider information given in the table below and answers the question asked thereafter: i. Calculate expected return on each stock? On the basis of this measure, which stock you will choose?ii. Calculate standard deviation of the returns on each stock? On the basis of this measure, which stock you will choose?iii. Calculate coefficient of variance of the returns on each stock? On the basis of this measure, which stock you will choose?iv. Calculate covariance and coefficient of correlation between the returns of the stocks A and B.v. Now suppose you have $100,000 to invest and you want to a hold a portfolio comprising of $35,000 invested in stock A and remaining amount in stock B. Calculate risk and return of your portfolio. (d) Firm A reports a Profit Margin of 6.5% and a Total Asset Turnover Ratio of 3.25. Their total asset level is $8,500,000. Assume there are 700,000 shares outstanding and the PE ratio is 11. Also, assume the Return on Equity is 16%. Based on this, calculate…arrow_forward
- Questions: a. Compute the expected return for stock X and for stock Y b. Compute the standard deviation for stock X and for stock Y. c. Determine the best course to take for investing.arrow_forwardFill the parts in the above table that are shaded in yellow. You will notice that there are nineline items. Using the data generated in the previous question (Question 1);a) Plot the Security Market Line (SML) b) Superimpose the CAPM’s required return on the SML c) Indicate which investments will plot on, above and below the SML?d) If an investment’s expected return (mean return) does not plot on the SML, what doesit show? Identify undervalued/overvalued investments from the graph Please answer A, B, C & Darrow_forwardConsider the stocks in the table with their respective beta coefficients to answer the following questions:a. Which of the assets represents the most sensitive to fluctuations or changes in market returns and why? What impact in terms of risk and return would this asset have if you add it to an investment portfolio in a higher proportion than all other assets? b. Which of the assets represents the least sensitive to fluctuations or changes in market returns and why? What impact in terms of risk and return would this asset have, if you add it to an investment portfolio in a greater proportion than all other assets? Stock Beta SKT 0.65 COST 0.90 SU 1.42 AMZN 1.57 V 0.94arrow_forward
- QUESTIONS: 1) Assuming that the risk-free rate of return is currently 3,2%, the market risk premium is 6% whereas the beta of HelloFresh SH. stock is 1.8, compute the required rate of return using CAPM. 2) Compute the value of each investment based on your required rate of return and interpret the results comparing with the market values. 3) Which investment would you select? Explain why using appropriate financial jargon (language). 4) Assume HelloFresh SH's CFO Mr. Christian Gaertner expects an earnings upturn resulting increase in growth (rate) of 1%. How does this affect your answers to Question 2 and 3? 5) AACSB Critical Thinking Questions: A) Companies pay rating agencies such as Moody's and S&P to rate their bonds, and the costs can be substantial. However, companies are not required to have their bonds rated in the first place; doing so is strictly voluntary. Why do you think they do it? (Textbook page: 198) B) What are the difficulties in using the PE ratio to value stock?…arrow_forwardd. Interpret your results in (c) above, assuming that the historical average return of 8.5% from the stock is a good benchmark. e. Critically evaluate the strengths and weaknesses of applying the implied rate of return from the RIVM as a proxy of the expected return.arrow_forwardConsider the following information about the various states of the economy and the returns of various investment alternatives for each scenario. Answer the questions that follow. Question 1 Fill in the parts in the above table that are empty. Using the data generated in the previous question (Question 1); Plot the Security Market Line (SML) 2. Superimpose the CAPM’s required return on the SML % Return on T-Bills, Stocks, and Market Index State of the Economy Probability T- Bills Phillips Pay- up Rubber- made Market Index Recession 0.2 7 -22 28 10 -13 Below Average 0.1 7 -2 14.7 -10 1 Average 0.3 7 20 0 7 15 Above Average 0.3 7 35 -10 45 29 Boom 0.1 7 50 -20 30 43 Mean Standard Deviation Coefficient of Variation Covariance with MP…arrow_forward
arrow_back_ios
SEE MORE QUESTIONS
arrow_forward_ios
Recommended textbooks for you
 EBK CONTEMPORARY FINANCIAL MANAGEMENTFinanceISBN:9781337514835Author:MOYERPublisher:CENGAGE LEARNING - CONSIGNMENT
 Intermediate Financial Management (MindTap Course...FinanceISBN:9781337395083Author:Eugene F. Brigham, Phillip R. DavesPublisher:Cengage Learning
EBK CONTEMPORARY FINANCIAL MANAGEMENT
Finance
ISBN:9781337514835
Author:MOYER
Publisher:CENGAGE LEARNING - CONSIGNMENT
Intermediate Financial Management (MindTap Course...
Finance
ISBN:9781337395083
Author:Eugene F. Brigham, Phillip R. Daves
Publisher:Cengage Learning
What is Risk Management? | Risk Management process; Author: Educationleaves;https://www.youtube.com/watch?v=IP-E75FGFkU;License: Standard youtube license