Foundations Of Finance
10th Edition
ISBN: 9780134897264
Author: KEOWN, Arthur J., Martin, John D., PETTY, J. William
Publisher: Pearson,
expand_more
expand_more
format_list_bulleted
Concept explainers
Videos
Textbook Question
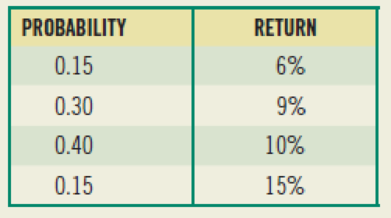
Chapter 6, Problem 3SP
(Expected
Expert Solution & Answer
Want to see the full answer?
Check out a sample textbook solution
Students have asked these similar questions
Using the data generated in the attached picture:
Plot the Security Market Line (SML)
Superimpose the CAPM’s required return on the SML
Indicate which investments will plot on, above and below the SML?
If an investment’s expected return (mean return) does not plot on the SML, what does it show? Identify undervalued/overvalued investments from the graph.
The higher a security's risk, the higher the return investors demand, and thus the less they are willing to pay for the investment. What do you understand from the statement mentioned above? Explain with necessary numerical data, and illustrate by means of a chart.
Using the data generated in the graph, show what the information looks like in a spreadsheet.
a) Plot the Security Market Line (SML)
b) Superimpose the CAPM’s required return on the SML
c) Indicate which investments will plot on, above, and below the SML?
d) If an investment’s expected return (mean return) does not plot on the SML, what does
it show? Identify undervalued/overvalued investments from the graph.
Chapter 6 Solutions
Foundations Of Finance
Ch. 6 - a. What is meant by the investors required rate of...Ch. 6 - Prob. 2RQCh. 6 - What is a beta? How is it used to calculate r, the...Ch. 6 - Prob. 4RQCh. 6 - Prob. 5RQCh. 6 - Prob. 6RQCh. 6 - Prob. 7RQCh. 6 - What effect will diversifying your portfolio have...Ch. 6 - (Expected return and risk) Universal Corporation...Ch. 6 - (Average expected return and risk) Given the...
Ch. 6 - (Expected rate of return and risk) Carter, Inc. is...Ch. 6 - (Expected rate of return and risk) Summerville,...Ch. 6 - Prob. 5SPCh. 6 - Prob. 9SPCh. 6 - Prob. 10SPCh. 6 - Prob. 11SPCh. 6 - Prob. 12SPCh. 6 - Prob. 14SPCh. 6 - (Capital asset pricing model) Using the CAPM,...Ch. 6 - Prob. 16SPCh. 6 - Prob. 17SPCh. 6 - a. Compute an appropriate rate of return for Intel...Ch. 6 - (Estimating beta) From the graph in the right...Ch. 6 - Prob. 20SPCh. 6 - Prob. 21SPCh. 6 - (Capital asset pricing model) The expected return...Ch. 6 - (Portfolio beta and security market line) You own...Ch. 6 - (Portfolio beta) Assume you have the following...Ch. 6 - Prob. 1MCCh. 6 - Prob. 2MCCh. 6 - Prob. 3MCCh. 6 - Prob. 4MCCh. 6 - Prob. 5MCCh. 6 - Prob. 6MCCh. 6 - Prob. 7MCCh. 6 - Prob. 8MCCh. 6 - Prob. 9MCCh. 6 - Prob. 10MCCh. 6 - Prob. 11MC
Knowledge Booster


Learn more about
Need a deep-dive on the concept behind this application? Look no further. Learn more about this topic, finance and related others by exploring similar questions and additional content below.Similar questions
- Using the data generated in the previous question (Question 1); a) Plot the Security Market Line (SML) b) Superimpose the CAPM’s required return on the SML c) Indicate which investments will plot on, above and below the SML? d) If an investment’s expected return (mean return) does not plot on the SML, what does it show? Identify undervalued/overvalued investments from the grapharrow_forwardWhich one of the following is the formula that explains the relationship between the expected returnon a security and the level of that security's systematic risk?Select one:a. Time value of money equationb. Unsystematic risk equationc. Expected risk formulad. Market performance equatione. Capital asset pricing modelarrow_forwardWhich is least likely correct about security valuation?a. The calculated or determined value considers the stream of future cash flows.b. The calculated or determined value equals the market price.c. The calculated or determined value considers the risks involved and the opportunity cost.d. The calculated or determined value allows the investors to evaluate whether a security isovervalued or undervalued.e. All of the abovearrow_forward
- Using the data generated in the previous question (Question 1) Plot the Security Market Line (SML) b) Superimpose the CAPM’s required return on the SML c) Indicate which investments will plot on, above and below the SML?arrow_forward6-3. (Expected rate of return and risk) Louis Vuitton SE is evaluating a security. Calculate the investment's expected return and its standard deviation. PROBABILITY RETURN 0.20 7% 0.25 10% 0.40 12% 0.15 18%arrow_forwardPlease answer each of the following questions in detail and provide examples for each of the questions below. Explain the criteria for assessing performance of a security, namely, expected rate of return, standard deviation of rate of return, and coefficient of variation (CV). Explain how by forming a portfolio an instrument can be generated that has properties better than each of its constituents in terms of the standard deviation of rate of return and CV. Kindly answer all the subparts with examples wherever asked.arrow_forward
- Fill the parts in the above table that are shaded in yellow. You will notice that there are nineline items. Using the data generated in the previous question (Question 1);a) Plot the Security Market Line (SML) b) Superimpose the CAPM’s required return on the SML c) Indicate which investments will plot on, above and below the SML?d) If an investment’s expected return (mean return) does not plot on the SML, what doesit show? Identify undervalued/overvalued investments from the graph Please answer A, B, C & Darrow_forwardPlot the Security Market Line (SML) b) Superimpose the CAPM’s required return on the SML c) Indicate which investments will plot on, above and below the SML? d) If an investment’s expected return (mean return) does not plot on the SML, what doesit show? Identify undervalued/overvalued investments from the graph (arrow_forwardPlease find the following: The investment's expected return as a percentage: The investment's standard deviation:arrow_forward
- The security market line depicts: a. Expected return as a function of systematic risk (indicated by beta) b. The market portfolio as the optimal portfolio of risky assets c. The relationship between a security’s return and the return on the index d. Portfolio combinations of the market portfolio and the risk-free asset e. Expected return as a function of volatilityarrow_forwardExplain how knowing the standard deviation of a security’s historical returns increases an investor’s understanding of that security’s expected future performance.arrow_forwardPlease answer each of the following questions in detail and provide examples for each of the questions below. Explain the criteria for assessing performance of a security, namely, expected rate of return, standard deviation of rate of return, and coefficient of variation (CV). Explain how by forming a portfolio an instrument can be generated that has properties better than each of its constituents in terms of the standard deviation of rate of return and CV. Kindly answer all the subparts with examples wherever asked. Also kindly answer in simple language and which is not plagiarized.arrow_forward
arrow_back_ios
SEE MORE QUESTIONS
arrow_forward_ios
Recommended textbooks for you

Portfolio Management; Author: DevTechFinance;https://www.youtube.com/watch?v=Qmw15cG2Mv4;License: Standard YouTube License, CC-BY