Managerial Accounting: Creating Value in a Dynamic Business Environment
12th Edition
ISBN: 9781260417074
Author: HILTON, Ronald
Publisher: MCGRAW-HILL HIGHER EDUCATION
expand_more
expand_more
format_list_bulleted
Videos
Textbook Question
Chapter 6, Problem 23E
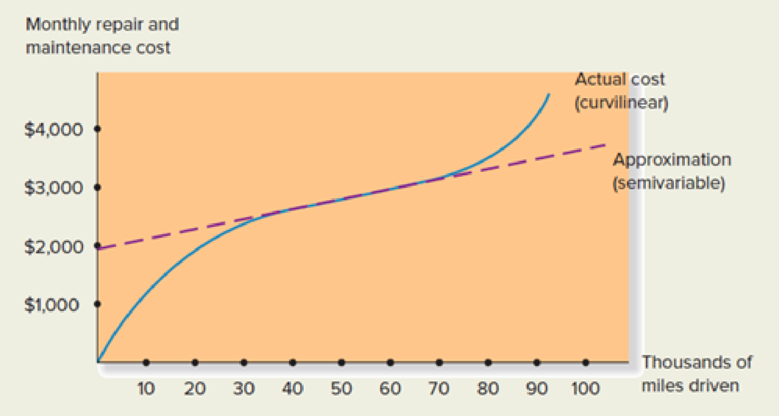
The behavior of the annual maintenance and repair cost in the Bus Transportation Department of the Summerset Public School District is shown by the solid line in the following graph. The dashed line depicts a semi variable-cost approximation of the department’s repair and maintenance cost.
Required:
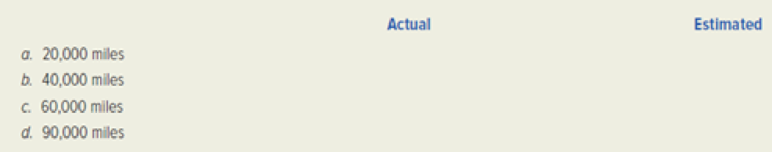
- 1. What is the actual (curvilinear) and estimated (semivariable) cost shown by the graph for each of the following activity levels?
- 2. How good an approximation does the semi variable-cost pattern provide if the department’s relevant range is 40.000 to 60.000 miles per month? What if the relevant range is 20.000 to 90.000 miles per month?
Expert Solution & Answer
Want to see the full answer?
Check out a sample textbook solution
Students have asked these similar questions
Which of the following will give you the most accurate allocation between a cost's fixed component and variable component?
a. Examination of a students’ registration forms for miscellaneous fees and tuition fees
b. Use of the least squares method to allocate the cost of electricity
c. Dividing the total cost on the water bill among the different departments based on direct labor hours
d. Dividing the total cost of the postpaid plan using the high-low method
The following activity and cost data that were provided by Hoist Corporation would help in
estimating its future maintenance costs:
Units
Maintenance cost
P1,350
7
P1,590
11
P1,920
15
P2,100
Using the least squares regression method to estimates the cost formula, the expected total
cost for an activity level of 10 units would be closest to:
Use the information below or using Exhibit 12.14 on page 577 in Zelman to answer the following questions.
Calculate the per unit cost of an initial visit using both the conventional and ABC approaches.
Calculate the per unit cost of a regular visit using both the conventional and ABC approaches.
Calculate the per unit cost of an intensive visit using both the conventional and ABC approaches.
Exhibit 12-14
Basic data and calculation of unit costs using a conventional approach
Total Cost by Visit Type
Basic Data
A
B
C
D
Initial
Regular
Intensive
Total
(Given)
(Given)
(Given)
(A + B + C)
1
Number of visits
8,000
26,000
8,600
42,600
2
Direct materials (etc.)
$40,000
$50,000
$65,000
$155,000
3
Direct labor
$100,000
$120,000
$280,000
$500,000…
Chapter 6 Solutions
Managerial Accounting: Creating Value in a Dynamic Business Environment
Ch. 6 - Describe the importance of cost behavior patterns...Ch. 6 - Define the following terms, and explain the...Ch. 6 - Suggest an appropriate activity base (or cost...Ch. 6 - Draw a simple graph of each of the following types...Ch. 6 - Explain the impact of an increase in the level of...Ch. 6 - Explain why a manufacturers cost of supervising...Ch. 6 - Explain the impact of an increase in the level of...Ch. 6 - Prob. 8RQCh. 6 - Indicate which of the following descriptions is...Ch. 6 - Prob. 10RQ
Ch. 6 - What is meant by a learning curve? Explain its...Ch. 6 - Suggest an appropriate independent variable to use...Ch. 6 - What is an outlier? List some possible causes of...Ch. 6 - Explain the cost estimation problem caused by...Ch. 6 - Describe the visual-fit method of cost estimation....Ch. 6 - What is the chief drawback of the high-low method...Ch. 6 - Explain the meaning of the term least squares in...Ch. 6 - Prob. 18RQCh. 6 - Prob. 19RQCh. 6 - List several possible cost drivers that could be...Ch. 6 - Prob. 21RQCh. 6 - Prob. 22ECh. 6 - The behavior of the annual maintenance and repair...Ch. 6 - WMEJ is an independent television station run by a...Ch. 6 - Jonathan Macintosh is a highly successful...Ch. 6 - Jonathan Macintosh is a highly successful...Ch. 6 - The Iowa City Veterinary Laboratory performs a...Ch. 6 - Chillicothe Meat Company produces one of the best...Ch. 6 - Rio Bus Tours has incurred the following bus...Ch. 6 - Prob. 31ECh. 6 - Prob. 32ECh. 6 - Prob. 33ECh. 6 - Gator Beach Marts, a chain of convenience grocery...Ch. 6 - For each of the cost items described below, choose...Ch. 6 - The following selected data were taken from the...Ch. 6 - Antioch Extraction, which mines ore in Montana,...Ch. 6 - Nations Capital Fitness, Inc. operates a chain of...Ch. 6 - The Allegheny School of Music has hired you as a...Ch. 6 - Prob. 40PCh. 6 - (Note: Instructors who wish to cover all three...Ch. 6 - Refer to the original data in the preceding...Ch. 6 - Shortly after being hired as an analyst with...Ch. 6 - The controller of Chittenango Chain Company...Ch. 6 - Dana Rand owns a catering company that prepares...Ch. 6 - Prob. 48PCh. 6 - Earth and Artistry, Inc. provides commercial...Ch. 6 - Prob. 51CCh. 6 - Refer to the data and accompanying information in...
Knowledge Booster


Learn more about
Need a deep-dive on the concept behind this application? Look no further. Learn more about this topic, accounting and related others by exploring similar questions and additional content below.Similar questions
- The regional transit authority for a major metropolitan area wants to determine whether there is a relationship between the age of a bus and the annual maintenance cost. A sample of 10 buses resulted in the following data: Develop a scatter chart for these data. What does the scatter chart indicate about the relationship between age of a bus and the annual maintenance cost? Use the data to develop an estimated regression equation that could be used to predict the annual maintenance cost given the age of the bus. What is the estimated regression model? Test whether each of the regression parameters β0 and β1 is equal to zero at a 0.05 level of significance. What are the correct interpretations of the estimated regression parameters? Are these interpretations reasonable? How much of the variation in the sample values of annual maintenance cost does the model you estimated in part (b) explain? What do you predict the annual maintenance cost to be for a 3.5-year-old bus?arrow_forwardThe graphs below represent cost behavior patterns that might occur in acompany's cost structure. The vertical axis represents total cost, and thehorizontal axis represents activity output. Required:For each of the following situations, choose the graph from the group a-1 that best illustrates the cost pattern involved. Also, for each situation,identify the driver that measures activity output. 1. The cost of power when a fixed fee of $500 per month is chargedplus an additional charge of $0.12 per kilowatt-hour used2. Commissions paid to sales representatives. Commissions arepaid at the rate of 5 percent of sales made up to total annual salesof $500,000, and 7 percent of sales above $500,000.3. A part purchased from an outside supplier costs $12 per part for the first 3,000 parts and $10 per part for all parts purchased inexcess of 3,000 units.4. The cost of surgical gloves, which are purchased in incrementsof 100 units (gloves come in boxes of 100 pairs).5. The cost of tuition at a…arrow_forwardSpecifically, Mr. Schaefer wants you to do the following: PART 1. Prepare a cost-volume-profit (CVP) analysis of the proposal's financial implications. 1. Specifically, prepare an analysis that includes the projected revenue, variable costs, and fixed costs for enrollment levels of 20, 25, 30 and 37 students using the monthly projections in Attachment A of the case. 2. Then, compute the weighted average contribution margin (CM) per student (computed as the total CM divided by the number of students enrolled) and 3. The number of students that need to enroll at each of the four levels of enrollment for the center to break even. For this analysis, I have provided an Excel template in which I have already sorted variable and fixed costs: I have included the raw data. Note: Your enrollment information has already been weighted so you will not need to calculate weights for your weighted average CM.arrow_forward
- Data table Month Total Cost Machine Hours January.. 3,420 1,090 February..... S 3,760 1,120 March .... $ 3,532 1,080 April ..... 3,720 1,220 May S 4,800 1,330 June 4,192 1,480 .. %24 %24arrow_forwardYou have been asked to decide about one of two mutually exclusive alternatives (A & B). The following table gives the initial costs, annual savings in labor costs, and the expected life of two pieces of equipment. Plot PW vs. i for each equipment on the same graph and identify the AAIRR from the graph (i for the intersection). Then, highlight the corresponding value of i in yellow in your spreadsheet. High-cost Equipment (A) Low-cost Equipment (B) Initial Cost $137,910 $100,000 Savings in Labor Costs $42,000 / year $32,000 / year Life 5 years 5 yearsarrow_forwardThe Allegheny School of Music has hired you as a consultant to help in analyzing the behavior of the school’s costs. Use the account-classification method of cost estimation to classify each of the following costs as variable, fixed, or semivariable. Before classifying the costs, choose an appropriate measure for the school’s activity. 1.Salaries and fringe benefits of the school’s full-time teachers. 2.Salaries and fringe benefits of the school’s full-time administrative staff. 3.Cost of buying books, sheet music, and other academic materials that are supplied to the students by the school. 4.Repairs on musical instruments. The school employs a full-time repair technician. Repair jobs that are beyond the technician’s capability are taken to a local musical-instrument dealer for repairs. 5.Fee charged by a local public accounting firm to audit the school’s accounting records. 6.Wages of the school’s part-time assistant recital instructors. These employees are hired on a tem-porary…arrow_forward
- Using the least-squares method of analyzing costs, answer the following questions and show computations to support your answers. a. What is the estimated variable portion of maintenance costs per labor hour? B.What is the estimated fixed maintenance cost each month? C.Formulate the regression equation D.If it is estimated that 600 labor hours will be used in July, what is the expected total power cost for July?arrow_forwardThe Long Haul Trucking Company is developing metrics for its drivers. The company computes variable costs of each load based upon miles driven and allocates fixed costs based upon time consumed. Load costing standards consider safe driving speeds and Department of Transportation regulations on hours of service (the amount of time the driver can be on duty or drive). The most effective metric for driver performance would likely be:a. Contribution per mile driven.b. Gross margin per mile driven.c. Achievement of delivered loads in allowed times.d. Percentage increase in delivered loads below standard.arrow_forwardEthan Manufacturing Incorporated produces floor mats for automobiles. The owner, Joseph Ethan, has asked you to assist in estimating maintenance costs. Together, you and Joseph determine that the single best cost driver for maintenance costs is machine hours. These data are from the previous fiscal year for maintenance costs and machine hours: 1. What is the cost equation for maintenance costs using the high-low method? 2. Calculate the mean absolute percentage error (MAPE) for the cost equation you developed in requirement 1. Month Maintenance Costs Machine Hours 1 $ 2,660 1,750 2 2,820 1,830 3 2,970 1,910 4 3,080 1,930 5 3,160 1,960 6 3,130 1,940 7 3,070 1,920 8 2,910 1,900 9 2,680 1,760 10 2,280 1,160 11 2,290 1,360 12 2,510 1,650arrow_forward
- If the plant manager uses the average cost per unit to predict total costs, what would the forecast be for 1,900 mailboxes? 5. If the plant manager uses the cost equation to predict total costs, what would the forecast be for 1,900 mailboxes? 6. What is the dollar difference between your answers to questions 4 and 5? Which approach to forecasting costs is appropriate? Why?arrow_forwardLeast-Squares Regression Method; Scattergraph; Cost Behavior Professor John Morton has just been appointed chairperson of the Finance Department at Westland University. In reviewing the department’s cost records. Professor Morton has found the following total cost associated with Finance 101 over the last five terms: Professor Morton knows that there are some variable costs, such as amounts paid to graduate assistants, associated with the course. He would like to have the variable and fixed costs separated for planning purposes. Required: 1. Prepare a scattergraph plot. (Plot total cost on the vertical axis and number of sections offered on the horizontal axis.) 2. Using the least-squares regression method, estimate the variable cost per section and the total fixed cost per term for Finance 101. Express these estimates in the form Y = a + bX. 3. Assume that because of the small number of sections offered during the Winter Term this year. Professor Morton will have to offer eight…arrow_forwardVariable Costing Income Statement for a Service Company The actual and planned data for Underwater University for the Fall term were as follows: Enrollment Tuition per credit hour Credit hours Registration, records, and marketing costs per enrolled student Revenue Variable costs: Registration, records, and marketing costs $ Instructional costs Total variable costs Instructional costs per credi ur Depreciation on classrooms and equipment Registration, records, and marketing costs vary by the number of enrolled students, while instructional costs vary by the number of credit hours. Depreciation is a fixed cost. Contribution margin Depreciation on classrooms and equipment Operating income $ Actual $ 4,500 Prepare a variable costing income statement showing the contribution margin and operating income for the Fall term. Underwater University Variable Costing Income Statement For the Fall Term $ $120 60,450 $275 $64 $825,600arrow_forward
arrow_back_ios
SEE MORE QUESTIONS
arrow_forward_ios
Recommended textbooks for you
 Essentials of Business Analytics (MindTap Course ...StatisticsISBN:9781305627734Author:Jeffrey D. Camm, James J. Cochran, Michael J. Fry, Jeffrey W. Ohlmann, David R. AndersonPublisher:Cengage Learning
 Excel Applications for Accounting PrinciplesAccountingISBN:9781111581565Author:Gaylord N. SmithPublisher:Cengage Learning
 Principles of Accounting Volume 2AccountingISBN:9781947172609Author:OpenStaxPublisher:OpenStax College
 Managerial Accounting: The Cornerstone of Busines...AccountingISBN:9781337115773Author:Maryanne M. Mowen, Don R. Hansen, Dan L. HeitgerPublisher:Cengage Learning
 Managerial AccountingAccountingISBN:9781337912020Author:Carl Warren, Ph.d. Cma William B. TaylerPublisher:South-Western College Pub
Essentials of Business Analytics (MindTap Course ...
Statistics
ISBN:9781305627734
Author:Jeffrey D. Camm, James J. Cochran, Michael J. Fry, Jeffrey W. Ohlmann, David R. Anderson
Publisher:Cengage Learning
Excel Applications for Accounting Principles
Accounting
ISBN:9781111581565
Author:Gaylord N. Smith
Publisher:Cengage Learning
Principles of Accounting Volume 2
Accounting
ISBN:9781947172609
Author:OpenStax
Publisher:OpenStax College
Managerial Accounting: The Cornerstone of Busines...
Accounting
ISBN:9781337115773
Author:Maryanne M. Mowen, Don R. Hansen, Dan L. Heitger
Publisher:Cengage Learning
Managerial Accounting
Accounting
ISBN:9781337912020
Author:Carl Warren, Ph.d. Cma William B. Tayler
Publisher:South-Western College Pub
How to Estimate Project Costs: A Method for Cost Estimation; Author: Online PM Courses - Mike Clayton;https://www.youtube.com/watch?v=YQ2Wi3Jh3X0;License: Standard Youtube License