
Econ Micro (book Only)
6th Edition
ISBN: 9781337408066
Author: William A. McEachern
Publisher: Cengage Learning
expand_more
expand_more
format_list_bulleted
Question
Chapter 6, Problem 10P
To determine
The way we can say that a rider has derived his
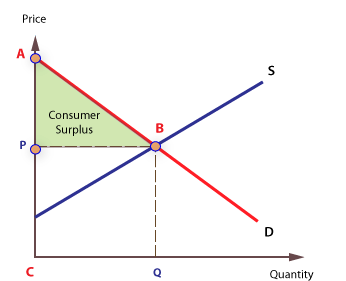
Consumer surplus:
It is the difference between the
Expert Solution & Answer
Want to see the full answer?
Check out a sample textbook solution
Students have asked these similar questions
(Figure: Market Demand for Oranges) Consider the figure Market Demand for Oranges. The amount by which the total
If the price of oranges is
benefits of oranges to consumers exceed consumers' total expenditures on oranges is called
B, this quantity is depicted by the area
Price
(per bushel)
0
producer surplus; BCD
consumer surplus; OCDE
consumer surplus; BCD
net benefit; OBDE
Market
Demand
Quantity
(per period)
3. Consumer surplus for a group of consumers
The following graph shows the demand curve for a group of consumers in the U.S. market (blue line) for smartphones. The market price of a smartphone is shown by the black horizontal line at $120.
Each rectangle you can place on the following graph corresponds to a particular buyer in this market: orange (square symbols) for Kevin, green (triangle symbols) for Maria, purple (diamond symbols) for Rajiv, tan (dash symbols) for Simone, and blue (circle symbols) for Yakov. Use the rectangles to shade the areas representing consumer surplus for each person who is willing and able to purchase a smartphone at a market price of $120. (Note: If a person will not purchase a smartphone at the market price, indicate this by leaving his or her rectangle in its original position on the palette.)
3. Consumer surplus for a group of consumers
The following graph plots the demand curve (blue line) for several consumers in the market for bluetooth speakers in Mead, a small town located in
Colorado. The Mead market price of a bluetooth speaker is given by the horizontal black line at $35.
Each rectangle you can place on the following graph corresponds to a particular buyer in this market: orange (square symbols) for Dmitri, green
(triangle symbols) for Frances, purple (diamond symbols) for Jake, tan (dash symbols) for Latasha, and blue (circle symbols) for Nick. Use the
rectangles to shade the areas representing consumer surplus for each person who is willing and able to purchase a bluetooth speaker at a market
price of $35. (Note: If a person will not purchase a bluetooth speaker at the market price, indicate this by leaving his or her rectangle in its original
position on the palette.)
PRICE (Dollars per bluetooth speaker)
5
80
S
70
60
50
40
30
20
5
10
0
0
1
Dmitri
2
Frances
3…
Chapter 6 Solutions
Econ Micro (book Only)
Knowledge Booster

Similar questions
- 2. In most cases, a demand curve has a shape that we call "downward sloping". This means that it looks like a diagonal line going from the top left to the bottom right of a market graph. Why does demand usually have this shape? Explain in your own words. Make sure to include the concept of marginal benefit (a.k.a. marginal utility) in your explanation.arrow_forward1. (a) Which causes a shortage of a good--- a price ceiling or a price floor? Justify your answer with a graph. (b) What is a budget constraint? A consumer has an income of $3000. Soda costs $3 per liter and cheese costs $6 per pound. Draw the consumer's budget constraint with soda on the vertical axis. What is the slope of this budget constraint?arrow_forward04. Assuming this market is at equilibrium, what is the "consumer's surplus"? a) $16 b) $72 c) $32 d) $12 e) $6arrow_forward
- 6. Suppose that demand and supply of apples are described by the following equations: P = 100 - 3Q (demand) P = 20 + Q (supply) a) Calculate the equilibrium price and quantity. Illustrate. b) Suppose a $4 tax is placed on apples. What is the new equilibrium quantity? How much do consumers pay to get this quantity? How much do suppliers receive for selling this quantity? Show your results on a supply & demand diagram.arrow_forwardshift in demand or supply Suppose the price of muffins decreases. (Assume that people regard donuts and muffins as substitutes) What way would a supply curve shift to the left or to the right? what way would a demand curve shift to the left or to the right? If donuts are a normal good, this will cause the demand for donuts to either increase or decrease?arrow_forward18. _____________________refers to various quantities of a commodity or service that a consumer would purchase at a given time at various prices in a market.arrow_forward
- (Figure: Good Y and Good X) Suppose the budget constraint shifted from constraint 2 to constraint 1. What could have caused this change? Quantity of good Y 18 16 14 12 10 8 6 4 2 Budget constraint 2 0 Budget constraint 1 2 4 6 8 10 12 14 16 18 20 Quantity of good X a decrease in the price of good X relative to that of good Y an increase in the price of good X and no change in the price of Y a decrease in income a decrease in income and an increase in the price of good X relative to that of good Yarrow_forward(Table: Equilibrium Price, Quantity) Refer to the table. If the demand curve for the product shifted to the right such that 10 more units of the good are demanded at every price, what is the new equilibrium price? P $10 12 14 16 18 0000 $12 $14 $16 $18 Q₁ 50 45 40 35 30 0. 30 35 40 45 30arrow_forward8. The government of OZLand announces that on 1 July 2008 it will introduce a new tax on digital TVs. The announcement is made on 1 January 2008. It is known that the effect of the tax will be to increase the price of digital TVs after 1 July 2008. Prior to 1 July 2008 it would be expected that the effect of buyers knowing that the tax will be introduced would be to: a) Increase the equilibrium price of digital TVs Decrease demand for digital TVs b) c) Decrease the equilibrium quantity traded of digital TVs d) Be zero since the tax has not been introduced yet e) Both (a) and (c)arrow_forward
- 7. Phillip sold 1200 tickets for the holiday concert at Earl Haig for $20 per ticket. His committee is planning to increase the prices this year. Their research has shown that for each $2 increase in the price of the tickets, 60 fewer tickets will be sold. a) What should Phillip's committee sell each ticket for, to maximize their revenue? b) How many tickets will be sold at the maximum revenue? c) What is the maximum revenue?arrow_forward4 Assume we live in an economy with only two available goods, X and Y. Suppose that we experience an increase in consumer income. If Y is an inferior good, then what cannot happen from the choices below? decrease the demand for Y. decrease the demand for X. increase the demand for X. make the consumer better off.arrow_forward4. Study Questions and Problems #4 The following graph shows the supply curve for condominiums in a large city. Assume that all condos are identical and sell for the same price. Initially, the graph shows market demand under the following circumstances: Average excise taxes are 15% per year, and the price of business parks is $1,000,000. Use the graph input tool to help you answer the following questions. You will not be graded on any changes you make to this graph. (Note: Once you enter a value in a white field, the graph and any corresponding amounts in each grey field will change accordingly.) PRICE (Thousands of dollars) 500 450 400 350 300 250 200 150 - 100 50 0 0 Supply for Condominiums Supply 20 40 60 80 100 120 140 160 180 200 QUANTITY (Condos built per year) Graph Input Tool Supply of Condominiums Price of a Condo (Thousands of dollars) Quantity Supplied (Condos per year) Supply Shifters Taxes (Percent) Price of a Business Park (Millions of dollars) Suppose that the price of a…arrow_forward
arrow_back_ios
SEE MORE QUESTIONS
arrow_forward_ios
Recommended textbooks for you

 Principles of MicroeconomicsEconomicsISBN:9781305156050Author:N. Gregory MankiwPublisher:Cengage Learning
Principles of Microeconomics
Economics
ISBN:9781305156050
Author:N. Gregory Mankiw
Publisher:Cengage Learning