
Biology (MindTap Course List)
11th Edition
ISBN: 9781337392938
Author: Eldra Solomon, Charles Martin, Diana W. Martin, Linda R. Berg
Publisher: Cengage Learning
expand_more
expand_more
format_list_bulleted
Concept explainers
Videos
Textbook Question
Chapter 57, Problem 17TYU
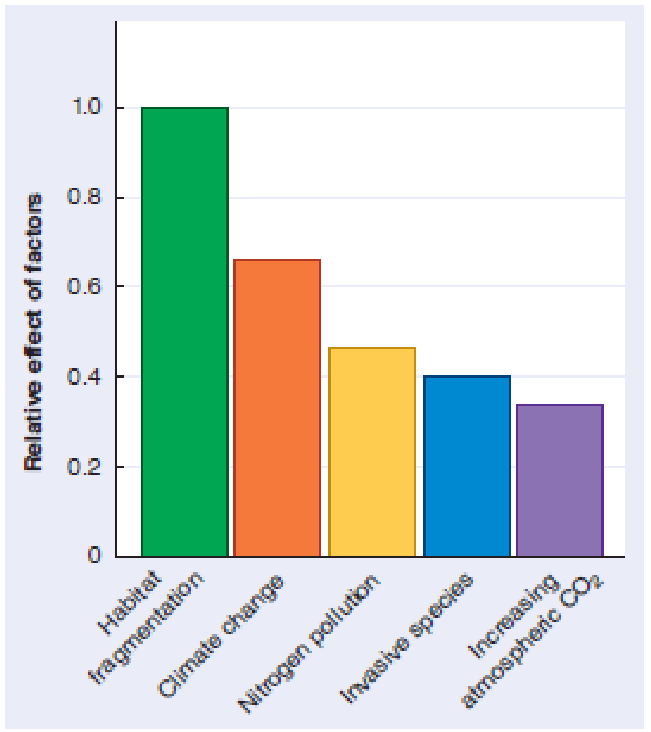
INTERPRET DATA Study the graph, which shows the combined effects of various factors on biological diversity in 12 different terrestrial and aquatic ecosystems. Which factor is most important overall? Why do you think that climate change and increasing atmospheric CO2 are represented as separate factors? What is nitrogen pollution? Adapted from Sala, O.E., et al., Science, Vol. 287 (2000).
Expert Solution & Answer
Want to see the full answer?
Check out a sample textbook solution
Students have asked these similar questions
Study these two figures? Which graph represents Semibalanus?
(d) When competition is asymmetric and niches do not overlap
completely, weaker competitors use nonoverlapping resources.
Chthamalus in
Species 1
(strong competitor) (weak competitor)
upper intertidal zone
Species 2
fig 53.5
Fundamental
Mean tide level
niche
Realized
Semibalanus in lower
intertidal zone
niche
O Pon Beran Cuminga Ar erve
Niche (range of resources used)
Copyright e 2008 Pearson Benjamin Cumnings. Alrights reserved.
A. purple graph (left)
B. green graph (right)
A. purple graph (left)
B. green graph (right)
Number of individuals
using resource
What is the relationship between an increase in fossil fuel consumption and increased carbon in terrestrial plants? How might this change flora populations? What impact could twenty years at this level of consumption have on flora?
What is the relationship between an increase in total carbon concentration (the smokestack) and increased carbon in the ocean surface? How might this change marine life populations? What impact could fifty years at this level of emissions have on marine fauna? On marine flora?
In addition to circulating through the carbon cycle, where else might excess carbon be found? In fifty years, where would you be most likely to see excess carbon?
Which areas are most highly (and quickly) affected by an increase in carbon emissions (and increase in fossil fuel consumption)? How would these effects manifest themselves? What are the dangers/benefits to these areas?
a) Provide the terms necessary to fill in the blanks (i - v) in the diagram below that represents two key components of ecosystem ecology. Be sure to use terminology consistent with the rest of the diagram.
b) What fundamental ecosystem processes are illustrated in the diagram below by the solid arrows and by dashed arrows?
Chapter 57 Solutions
Biology (MindTap Course List)
Ch. 57.1 - Identify various levels of biodiversity: genetic...Ch. 57.1 - Prob. 2LOCh. 57.1 - Discuss at least four causes of declining...Ch. 57.1 - Prob. 1CCh. 57.1 - Prob. 2CCh. 57.1 - Prob. 3CCh. 57.1 - Prob. 4CCh. 57.2 - Prob. 4LOCh. 57.2 - Prob. 5LOCh. 57.2 - Prob. 1C
Ch. 57.2 - Prob. 2CCh. 57.2 - Prob. 3CCh. 57.2 - Why is the U.S. Endangered Species Act...Ch. 57.3 - Prob. 6LOCh. 57.3 - Prob. 7LOCh. 57.3 - Prob. 1CCh. 57.3 - What are two reasons for deforestation in tropical...Ch. 57.4 - Prob. 8LOCh. 57.4 - Prob. 9LOCh. 57.4 - Prob. 1CCh. 57.4 - Prob. 2CCh. 57 - Which of the following statements about extinction...Ch. 57 - Prob. 2TYUCh. 57 - Prob. 3TYUCh. 57 - Prob. 4TYUCh. 57 - Prob. 5TYUCh. 57 - Prob. 6TYUCh. 57 - Prob. 7TYUCh. 57 - Prob. 8TYUCh. 57 - CONNECT What gas is a human-made pollutant in the...Ch. 57 - Prob. 10TYUCh. 57 - Why might captive-breeding programs that...Ch. 57 - Prob. 12TYUCh. 57 - Prob. 13TYUCh. 57 - Prob. 14TYUCh. 57 - EVOLUTION LINK Biologists have wondered how...Ch. 57 - Prob. 16TYUCh. 57 - INTERPRET DATA Study the graph, which shows the...Ch. 57 - Prob. 18TYU
Knowledge Booster


Learn more about
Need a deep-dive on the concept behind this application? Look no further. Learn more about this topic, biology and related others by exploring similar questions and additional content below.Similar questions
- What ecological concept is being shown in this graph? In what areacan we apply this concept? Explain your answer and provideexamples.arrow_forwardExplain the three ecological pyramids. What data is propagated by each pyramid in association with function, structure and energy in the ecosystem?arrow_forwardThe authors of the article state that the physical and chemical environment of marine habitats can affect all of the following, except: a:structure of communities. b:calcification rates. c:species ranges. d:aggressiveness of invasive species. article reference: https://www.frontiersin.org/articles/10.3389/fmars.2023.1075228/full the link for the article is all i could include but ill post the name of the article as well. Responses of intertidal invertebrates to rising sea surface temperatures in the southeastern Indian Ocean by Fred E. Wellsarrow_forward
- choose the correct alternative on the biotic potential influences:a) the average number of offspring producedb) the size of the individualsc) mortalityd) migration ratearrow_forwardDetermine if each statement is correct or incorrect: 1. Ecosystems with fewer numbers of species tend to be less stable. 2. Increasing numbers of species lead to more redundancy which is bad for the ecosystem. 3. More species mean more niche separation. 4. Species with a low resistance will also have low resilience. 5. Disturbances to ecosystems can be both naturally occurring and human caused. 6. Stresses to ecosystems are useful for removing weaker species and ensuring the strongest survive. 7. Bringing non-native species into an area to increase biodiversity makes the ecosystem more stable.arrow_forwardExplain the three ecological pyramids.What data is propagated by each pyramid in association with function in ecosystem?arrow_forward
- A conceptual model representing the role, interaction, reaction, and density of essential ecosystem components is shown below. Examine the model and the relationships between the major players (i.e., predator, prey, producer). The structure's most important role is played by these major players. It's also worth noting that nutrition has been included in the model. This is the abiotic component that has a direct or indirect impact on the interaction. Question: Based on this scenario, what is the most significant role of sea otters in the marine community? Why it’s important?arrow_forwardChoose one of the following factors and explain how and why species richness varies with it: temporal variation, latitude, succession. Give a specific example.arrow_forwardA conceptual model representing the role, interaction, reaction, and density of essential ecosystem components is shown below. Examine the model and the relationships between the major players (i.e., predator, prey, producer). The structure's most important role is played by these major players. It's also worth noting that nutrition has been included in the model. This is the abiotic component that has a direct or indirect impact on the interaction. Question: Why does the organism’s interaction appear in an oscillating pattern? What does it suggest?arrow_forward
- x Read the abstract from the scientific journal article: Helfield, JM and RJ Naiman. 2001. Effects of salmon-derived nitrogen on riparian forest growth and implications for stream productivity. Ecology 82 no. 9: 2403-2409. From this Abstract section, select all below that correctly identify conclusions of this paper. Growth rates are significantly increased in Sitka spruce near spawning streams. Trees and shrubs near spawning streams derive ~34-43% of their foliar nitrogen (N) from spawning salmon. Trees and shrubs near spawning streams derive ~22-24% of their foliar nitrogen (N) from spawning salmon. Riparian forests affect the quality of instream habitat through shading, sediment and nutrient filtration. Riparian forests affect the quality of instream habitat by producing woody debris, a fertilization process that enhanced streambank production but also serves to improve streams for spawning and rearing of young salmon. Growth rates of Sitka spruce near spawning streams were no…arrow_forwardAnswer these two questions A) What are the abiotic factors that support different types of life? B) Explain how ecosystem diversity results in species diversity in a healthy biospherearrow_forwardIf you had to monitor an ecosystem for evidence of pollution, what are one or two indicator species you would want to pay particularly close attention to? You may discuss specific species of organisms, or can discuss organisms that occupy a specific trophic level in an ecosystem’s food web. Explain why you would select these species or this trophic level.arrow_forward
arrow_back_ios
SEE MORE QUESTIONS
arrow_forward_ios
Recommended textbooks for you
 Biology (MindTap Course List)BiologyISBN:9781337392938Author:Eldra Solomon, Charles Martin, Diana W. Martin, Linda R. BergPublisher:Cengage Learning
 Biology: The Dynamic Science (MindTap Course List)BiologyISBN:9781305389892Author:Peter J. Russell, Paul E. Hertz, Beverly McMillanPublisher:Cengage Learning
Biology (MindTap Course List)
Biology
ISBN:9781337392938
Author:Eldra Solomon, Charles Martin, Diana W. Martin, Linda R. Berg
Publisher:Cengage Learning
Biology: The Dynamic Science (MindTap Course List)
Biology
ISBN:9781305389892
Author:Peter J. Russell, Paul E. Hertz, Beverly McMillan
Publisher:Cengage Learning
6th Grade Science - Module 2: Physical & Chemical Properties; Author: iUniversity Prep;https://www.youtube.com/watch?v=4DONkU6c2Rs;License: Standard youtube license