
Concept explainers
Videos
Consumer Price Index The following graph shows the approximate value of the U.S. Consumer Price Index (CPI) from July 2005 through March 2007:
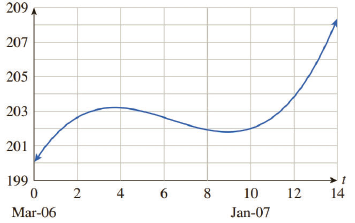
The approximating curve shown on the figure is given by
where t is time in months. (
a. Locate the intercepts, extrema, and points of inflection of the curve, and interpret each feature in terms of the CPI. (Approximate all coordinates to one decimal place.) [HINT: See Example 1.]
b. Recall from Section 5.2 that the inflation rate is defined to be
Want to see the full answer?
Check out a sample textbook solution
Chapter 5 Solutions
Applied Calculus


- Use the table of values you made in part 4 of the example to find the limiting value of the average rate of change in velocity.arrow_forwardThe half-life of plutonium-244 is 80,000,000 years. Find function gives the amount of carbon-14 remaining as a function of time, measured in years.arrow_forwardbThe average rate of change of the linear function f(x)=3x+5 between any two points is ________.arrow_forward
 Algebra & Trigonometry with Analytic GeometryAlgebraISBN:9781133382119Author:SwokowskiPublisher:Cengage
 College AlgebraAlgebraISBN:9781305115545Author:James Stewart, Lothar Redlin, Saleem WatsonPublisher:Cengage Learning
 Calculus For The Life SciencesCalculusISBN:9780321964038Author:GREENWELL, Raymond N., RITCHEY, Nathan P., Lial, Margaret L.Publisher:Pearson Addison Wesley,
 Functions and Change: A Modeling Approach to Coll...AlgebraISBN:9781337111348Author:Bruce Crauder, Benny Evans, Alan NoellPublisher:Cengage Learning
 Algebra and Trigonometry (MindTap Course List)AlgebraISBN:9781305071742Author:James Stewart, Lothar Redlin, Saleem WatsonPublisher:Cengage Learning