
Concept explainers
Videos
Scientific Research: 1983–2003 The percentage of research articles in the prominent journal Physical Review that were written by researchers in the United States during 1983–2003 can be modeled by
Where t is time in years since 1983. The graphs of
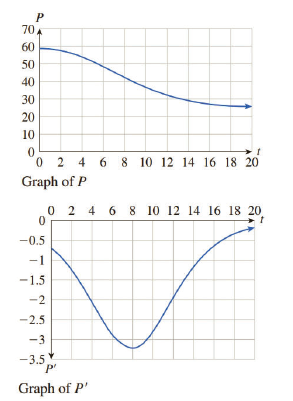
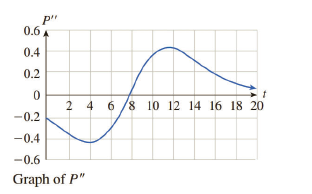
Determine, to the nearest whole number, the values of t for which the graph of P is concave up and where it is concave down, and locate any points of inflection. What does the point of inflection tell you about science articles? [HINT: See Example 4.]
Want to see the full answer?
Check out a sample textbook solution
Chapter 5 Solutions
Applied Calculus


- Cell Phones Using the CTIA Wireless Survey for1985–2009, the number of U.S. cell phone subscribers (in millions) can be modeled byy = 0.632x2 - 2.651x + 1.209where x is the number of years after 1985.a. Graphically find when the number of U.S.subscribers was 301,617,000.b. When does the model estimate that the number ofU.S. subscribers would reach 359,515,000?c. What does the answer to (b) tell about this model?arrow_forwardNational Debt The size of the total debt owed by the UnitedStates federal government continues to grow. In fact,according to the Department of the Treasury, the debt perperson living in the United States is approximately $53,000(or over $140,000 per U.S. household). The following datarepresent the U.S. debt for the years 2001–2014. Since thedebt D depends on the year y, and each input correspondsto exactly one output, the debt is a function of the year. SoD1y2 represents the debt for each year y. Source: www.treasurydirect.govDebt (billions Debt (billionsYear of dollars) Year of dollars)2001 5807 2008 10,0252002 6228 2009 11,9102003 6783 2010 13,5622004 7379 2011 14,7902005 7933 2012 16,0662006 8507 2013 16,7382007 9008 2014 17,824 (a) Plot the points 12001, 58072, 12002, 62282, and so on ina Cartesian plane.(b) Draw a line segment from the point 12001, 58072 to12006, 85072. What does the slope of this line segmentrepresent?(c) Find the average rate of change of the debt from 2002…arrow_forwardQ1. The table provided gives data on indexes of output per hour (X) and real compensation per hour (Y) for the business and nonfarm business sectors of the U.S. economy for 1960–2005. The base year of the indexes is 1992 = 100 and the indexes are seasonally adjusted. a. Plot Y against X for the two sectors separately. b. What is the economic theory behind the relationship between the two variables? Does the scattergram support the theory? c. Estimate the OLS regression of Y on X. Note: on the table ( 1. Output refers to real gross domestic product in the sector. 2. Wages and salaries of employees plus employers’ contributions for social insurance and private benefit plans. 3. Hourly compensation divided by the consumer price index for all urban consumers for recent quarters.) Thank you!arrow_forward
- Each of Exercises 81–84 shows the graphs of the first and second derivatives of a function y = f(x). Copy the picture and add to it a sketch of the approximate graph of f, given that the graph passes through the point P.arrow_forwardWhich of the functions graphed in Exercises 1–6 are one-to-one, and which are not?arrow_forwardThis question has several parts that must be completed sequentially. The following table shows total military and arms trade expenditure for a certain country in 2000, 2006, and 2012. Year t (year since 2000) 0 6 12 Military Expenditure C(t)($ billion) 40 270 510 (a) Compute and interpret the average rate of change of C(t) over the period 2006–2012 (that is, [6, 12]). Be sure to state the units of measurement. (b) Compute and interpret the average rate of change of C(t) over the period [0, 12]. Be sure to state the units of measurement. Recall that the average rate of change of f(x) over the interval [a, b] is the change in f divided by the change in x. The symbol Δ means "change in." average rate of change of f = change in f change in x = Δf Δx = f(b) − f(a) b − a Note that the given chart provides data points in the form of (t, C(t)). Year t (year since 2000) 0 6 12 Military Expenditure C(t)($ billion) 40 270 510 In the…arrow_forward
 Algebra & Trigonometry with Analytic GeometryAlgebraISBN:9781133382119Author:SwokowskiPublisher:Cengage