
Concept explainers
Videos
Consumer Price Index The following graph shows the approximate value of the U.S. Consumer Price Index (CPI) from July 2005 through March 2006:
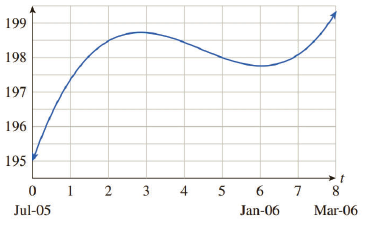
The approximating curve shown on the figure is given by
where t is time in months. (
a. Locate the intercepts, extrema, and points of inflection of the curve, and interpret each feature in terms of the CPI. (Approximate all coordinates to one decimal place.) [HINT: See Example 1.]
b. Recall from Section 5.2 that the inflation rate is defined to be

Trending nowThis is a popular solution!

Chapter 5 Solutions
Applied Calculus


 Algebra and Trigonometry (MindTap Course List)AlgebraISBN:9781305071742Author:James Stewart, Lothar Redlin, Saleem WatsonPublisher:Cengage Learning
 Calculus For The Life SciencesCalculusISBN:9780321964038Author:GREENWELL, Raymond N., RITCHEY, Nathan P., Lial, Margaret L.Publisher:Pearson Addison Wesley,
 Algebra & Trigonometry with Analytic GeometryAlgebraISBN:9781133382119Author:SwokowskiPublisher:Cengage
 Big Ideas Math A Bridge To Success Algebra 1: Stu...AlgebraISBN:9781680331141Author:HOUGHTON MIFFLIN HARCOURTPublisher:Houghton Mifflin Harcourt
 Functions and Change: A Modeling Approach to Coll...AlgebraISBN:9781337111348Author:Bruce Crauder, Benny Evans, Alan NoellPublisher:Cengage Learning
 College AlgebraAlgebraISBN:9781305115545Author:James Stewart, Lothar Redlin, Saleem WatsonPublisher:Cengage Learning