
To graph: The given function.
Given information:
Function
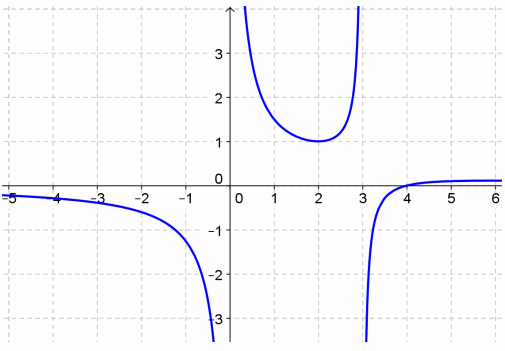
Graph:
Interpretation:
The numerator is 0 when
When
As
As
The vertical asymptotes are the zeros in the denominator.
Calculate some points, especially some close to the vertical asymptotes to see which way the graph goes.
| -4.0 | -0.29 |
| -3.0 | -0.39 |
| -2.0 | -0.60 |
| -1.0 | -1.25 |
| -0.4 | -3.24 |
| -0.3 | -4.34 |
| 0.3 | 4.57 |
| 0.4 | 3.46 |
| 1.0 | 13.45 |
| 2.0 | 6.79 |
| 3.0 | 2.8 |
| 4.0 | 0.00 |
Chapter 5 Solutions
Holt Mcdougal Larson Algebra 2: Student Edition 2012

 Algebra and Trigonometry (6th Edition)AlgebraISBN:9780134463216Author:Robert F. BlitzerPublisher:PEARSON
 Contemporary Abstract AlgebraAlgebraISBN:9781305657960Author:Joseph GallianPublisher:Cengage Learning
 Linear Algebra: A Modern IntroductionAlgebraISBN:9781285463247Author:David PoolePublisher:Cengage Learning
 Algebra And Trigonometry (11th Edition)AlgebraISBN:9780135163078Author:Michael SullivanPublisher:PEARSON
 Introduction to Linear Algebra, Fifth EditionAlgebraISBN:9780980232776Author:Gilbert StrangPublisher:Wellesley-Cambridge Press
 College Algebra (Collegiate Math)AlgebraISBN:9780077836344Author:Julie Miller, Donna GerkenPublisher:McGraw-Hill Education