
(a)
To Find: Enrollment at two-year intervals for the years
The enrollments are:
Given information:
The number
Explanation:
Make table as below:
| Year | ||
Therefore, the enrollments are
(b)
To graph: The given model.
Given information:
The number
Graph:
The graph of the given model is:
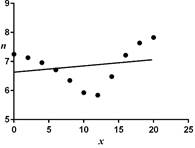
Interpretation:
The graph falls initially but then it again rises.
(c)
To Find: The year in which
Given information:
The number
Explanation:
Consider the graph of the given model.
Therefore,
(d)
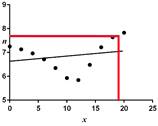
To determine: The trend of the graph.
The graph has an increasing trend.
Given information:
The number
Explanation:
Consider the graph of the given model.

The graph falls initially but then it again rises. Therefore, it has an increasing trend.
Chapter 5 Solutions
Holt Mcdougal Larson Algebra 2: Student Edition 2012

 Algebra and Trigonometry (6th Edition)AlgebraISBN:9780134463216Author:Robert F. BlitzerPublisher:PEARSON
 Contemporary Abstract AlgebraAlgebraISBN:9781305657960Author:Joseph GallianPublisher:Cengage Learning
 Linear Algebra: A Modern IntroductionAlgebraISBN:9781285463247Author:David PoolePublisher:Cengage Learning
 Algebra And Trigonometry (11th Edition)AlgebraISBN:9780135163078Author:Michael SullivanPublisher:PEARSON
 Introduction to Linear Algebra, Fifth EditionAlgebraISBN:9780980232776Author:Gilbert StrangPublisher:Wellesley-Cambridge Press
 College Algebra (Collegiate Math)AlgebraISBN:9780077836344Author:Julie Miller, Donna GerkenPublisher:McGraw-Hill Education