
Concept explainers
Videos
As we noted in the chapter opener, exports fear that without conservation efforts, tigers could disappear from the wild by 2022. Just one hundred years ago, there were at least 100,000 wild tigers. By 2010, the estimated world tiger population was 3200. The bar graph shows the estimated world tiger population for selected years from 1970 through 2010. Also shown is a polynomial function, with its graph, that models the data. Use this information to solve
Exercises 65 –68.
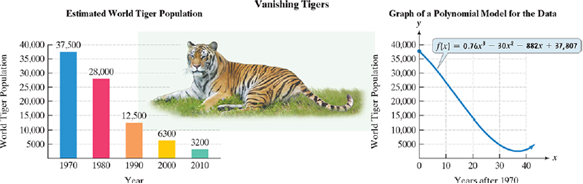
a. Find and interpret
Identify this information as a point on the graph of f.
b. Does
overestimate or underestimate the actual data shown by the bar graph? By how much?
Want to see the full answer?
Check out a sample textbook solution
Chapter 5 Solutions
Intermediate Algebra for College Students (7th Edition)


- In Exercises 67–70, use the following function.arrow_forwardThe average amount A (in pounds per person) of fish and shellfish consumed in the UnitedStates during the period 1992–2001 can be modeled by A = (3.2x + 260)/(52x + 3800) where x is the number of years since 1992.Rewrite the model so that it has only whole number coefficients. Then simplify the model.arrow_forwardAmerica is getting older. The graph shows the projected elderly U.S. population for ages 65–84 and for ages 85 and older.The formula E = 5.8√x + 56.4 models the projected number of elderly Americans ages 65–84, E, in millions, x years after 2020.a. Use the formula to find the projected increase in the number of Americans ages 65–84, in millions, from 2030 to 2060. Express this difference in simplified radicalform.b. Use a calculator and write your answer in part (a) to the nearest tenth. Does this rounded decimal overestimate or underestimate the difference in the projected data shown by the bar graph ? By how much?arrow_forward
- section 4.1 #30 In Exercises 25–30, determine whether the association between the two variables is positive or negative. Weekly ice cream sales and weekly average temperaturearrow_forwardIn Exercises 7–12, describe the relationship between the two quantities.arrow_forwardSection 2.4: Chain Rule In Exercises 9–34, find the derivative of the function.arrow_forward
- In 2010, MonsterCollege surveyed 1250 U.S.college students expecting to graduate in the next several years.Respondents were asked the following question:What do you think your starting salary will be at your firstjob after college?The line graph shows the percentage of college students whoanticipated various starting salaries. Use the graph to solveExercises 9–14. What starting salary was anticipated by the greatestpercentage of college students? Estimate the percentage ofstudents who anticipated this salary? What starting salary was anticipated by the least percentageof college students? Estimate the percentage of students whoanticipated this salary? What starting salaries were anticipated by more than 20% ofcollege students? Estimate the percentage of students who anticipated astarting salary of $40 thousand.arrow_forwardExercises 93–94: Energy The following graph shows U.S. Energy consumption. 400 350 300 250 200 150 100 50 04 1970 1990 2010 Year 93. When was energy consumption increasing? 94. When was energy consumption decreasing? Energy (millions of Btu)arrow_forwardIn Exercises 61–64, find an equation for the level surface of the function through the given point.arrow_forward
- For Exercises 49–52, rewrite the equation so that the coefficient on x is positive.arrow_forwardIn Exercises 65–68, find and sketch the domain of ƒ. Then find an equation for the level curve or surface of the function passing through the given point.arrow_forwardIn Exercises 13–24, draw a dependency diagram and write a Chain Rule formula for each derivative.arrow_forward
 Algebra & Trigonometry with Analytic GeometryAlgebraISBN:9781133382119Author:SwokowskiPublisher:Cengage