
Essentials Of Business Analytics
1st Edition
ISBN: 9781285187273
Author: Camm, Jeff.
Publisher: Cengage Learning,
expand_more
expand_more
format_list_bulleted
Videos
Textbook Question
Chapter 5, Problem 20P
The Seneca Children’s Fund (SCF) is a local charity that runs a summer camp for disadvantaged children. The fund’s board of directors has been working very hard over recent years to decrease the amount of overhead expenses, a major factor in how charities are rated by independent agencies. The following data show the percentage of the money SCF has raised that was spent on administrative and fund-raising expenses over the past seven years:
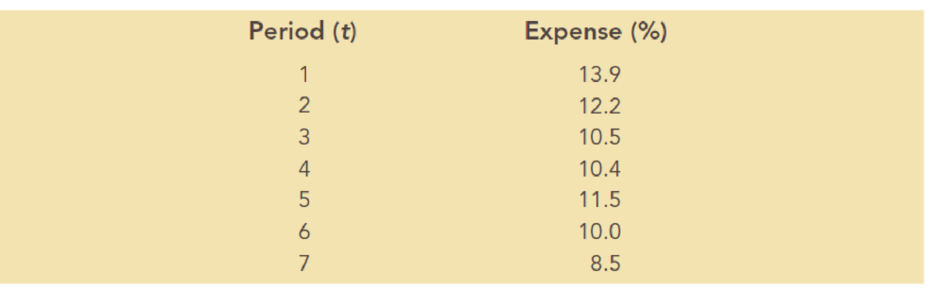
- a. Construct a time series plot. What type of pattern exists in the data?
- b. Use simple linear
regression analysis to find the parameters for the line that minimizes MSE for this time series. - c. Forecast the percentage of administrative expenses for year 8.
- d. If SCF can maintain its current trend in reducing administrative expenses, how long will it take SCF to achieve a level of 5% or less?
Expert Solution & Answer
Want to see the full answer?
Check out a sample textbook solution
Students have asked these similar questions
In 2011 home prices and mortgage rates dropped so low that in a number of cities the monthly cost of owning a home was less expensive than renting. The following data show the average asking rent for 10 markets and the monthly mortgage on the median priced home (including taxes and insurance) for 10 cities where the average monthly mortgage payment was less than the average asking rent (The Wall Street Journal, November 26–27, 2011).Click on the datafile logo to reference the data.
Enter negative values as negative numbers.
a. Develop the estimated regression equation that can be used to predict the monthly mortgage given the average asking rent (to 2 decimals).The regression equation is:Mortgage ($) = + Rent ($)
The Seneca Children’s Fund (SCC) is a local charity that runs a summer camp for disadvantagedchildren. The fund’s board of directors has been working very hard over recentyears to decrease the amount of overhead expenses, a major factor in how charities arerated by independent agencies. The following data show the percentage of the money SCChas raised that was spent on administrative and fund-raising expenses over the last sevenyears.
a. Construct a time series plot. What type of pattern exists in the data?b. Use simple linear regression analysis to find the parameters for the line that minimizesMSE for this time series.c. Forecast the percentage of administrative expenses for year 8.d. If SCC can maintain its current trend in reducing administrative expenses, how longwill it take SCC to achieve a level of 5 percent or less?
The monthly cost for health care for an employee and two dependents in a certain year is given in the following table.
Provider
Cost
Provider
Cost
Maxicare
$415.31
Kaiser
$4337
Cigna
$424.74
Aetna
$436.26
Health Net
$427.29
Blue Shield
$442.25
Pacific Care
$428.06
Omni Healthcare
$457.90
Redwoods Plan
$431.53
Lifeguard
$457.64
Draw a box plot for the monthly costs of health care (ranked from lowest to highest).
0415
420
425
430
435
440
0425
430
435
440
445
450
455
420
430
440
450
420
430
440
450
Chapter 5 Solutions
Essentials Of Business Analytics
Ch. 5 - Consider the following time series data:
Using...Ch. 5 - Refer to the time series data in Problem 1. Using...Ch. 5 - Problems 1 and 2 used different forecasting...Ch. 5 - Consider the following time series data:
Compute...Ch. 5 - Consider the following time series...Ch. 5 - Consider the following time series...Ch. 5 - Prob. 8PCh. 5 - Prob. 9PCh. 5 - Prob. 10PCh. 5 - For the Hawkins Company, the monthly percentages...
Ch. 5 - Corporate triple A bond interest rates for 12...Ch. 5 - The values of Alabama building contracts (in...Ch. 5 - The following time series shows the sales of a...Ch. 5 - Prob. 15PCh. 5 - The following table reports the percentage of...Ch. 5 - Consider the following time series: a. Construct a...Ch. 5 - Consider the following time series:
Construct a...Ch. 5 - The Seneca Children’s Fund (SCF) is a local...Ch. 5 - The president of a small manufacturing firm is...Ch. 5 - Consider the following time series: a. Construct a...Ch. 5 - Consider the following time series...Ch. 5 - The quarterly sales data (number of copies sold)...Ch. 5 - Prob. 25PCh. 5 - South Shore Construction builds permanent docks...Ch. 5 - Hogs & Dawgs is an ice cream parlor on the border...Ch. 5 - Donna Nickles manages a gasoline station on the...Ch. 5 - The Vintage Restaurant, on Captiva Island near...
Knowledge Booster


Learn more about
Need a deep-dive on the concept behind this application? Look no further. Learn more about this topic, statistics and related others by exploring similar questions and additional content below.Similar questions
- Google has changed its strategy with regard to how much and over which media it invests in advertising. The following table shows Google's marketing budget in millions of dollars for 2008 and 2011 (The Wall Street Journal, March 27, 2012). 2008 2011 Internet $26.0 $123.3 Newspaper, etc. $4.0 $20.7 Television $0.0 $69.3 a. Select a side-by-side bar chart with year as the variable on the horizontal axis.arrow_forward. Primary Data Source and Secondary Data Source ?arrow_forwardThe following table gives the annual revenue for the Microsoft Corp. in billions of dollars for a ten-year period. Year Microsoft 2007 2008 51 60 2009 2010 58 62 2011 2012 70 73 2013 2014 2015 2016 78 86 94 85 Construct and upload a boxplot for the Microsoft data. Be sure to label all the important numbers for the box plot.arrow_forward
- If all positions were paid equally, how much would Switzerland spend on wages for data processing in a year? A) CHF 1.03 billion B) CHF 3.45 billion C) CHF 162.5 billion D) CHF 103.9 billion E) CHF 188.5 billion Transcribed Image Text:Likelihood of industries becoming automated in the future Proportion of jobs and their risk of automation. Note: the graph shows a linear decrease in the proportion of jobs at risk of full automation. 60% 55% 50% 45% 40% 35% 30% 25% 20% 15% 10% 5% 0% LLL H Retail Waste Management Transportation and Storage Technical feasibility of job automation Likelihood of automating job tasks Predictable Physical Work Data Processing Data Collection Unpredictable Physical Work Stakeholder Interactions Applying Expertise with Clients Managing Others 0% Finance and Insurance Proportion of Jobs at Risk of Full Automation Employment Share of Total Jobs 5% 10% 15% Manufacturing 20% 25% 30% % of Tasks which could be Automated 35% Administration 40% 45% 50% 55%…arrow_forwardWhich type of data source provides real-time data? A. Historical data B. Survey data C. Transactional data D. Social media dataarrow_forwardSuppose the table below gives the average tuition and fees at 2-year and 4-year state schools in a particular state. Values are adjusted to 2019 dollars. Academic Year 4-year state school 2-year state school 2005-06 $5,904 $2,661 2006-07 $6,066 $2,539 2007-08 $6,289 $2,604 2008-09 $7,222 $2,901 2009-10 $7,738 $3,065 2010-11 $8,035 $3,117 2011-12 $8,154 $3,108 2012-13 $8,497 $3,075 2013-14 $8,578 $3,025 2014-15 $9,390 $3,326 2015-16 $10,004 $3,504 2016-17 $10,474 $3,663 2017-18 $10,789 $3,830 2018-19 $10,874 $3,859 2019-20 $10,900 $3,907 Here is a graph of the information from the table. a. What is the absolute change in tuition and fees at this state's four-year institutions from 2005-06 to 2019-20? b. What is the relative change in tuition and fees at this state's four-year institutions from 2005-06 to 2019-20? Round to the nearest whole percentage…arrow_forward
- Alice has accumulated $260,557 in savings and wishes to invest this money sensibly. The types of investments and their corresponding percentages, recommended by a financial advisor, are shown in the following circle graph. Recommended Categories of Investment: stocks 13.73% mutual funds 51% real estate 10% annuities10% bonds 15.27% Find the amount of money that Alice should invest in stocks, mutual funds, real estate, annuities, and bonds. Round your answer to the nearest hundredth, if necessary.arrow_forwardThe box-and-whisker plots show the Test Scores of five schools that have written a common exam.arrow_forwardWrite a mathematical scenario to describe each of the scatter plots.arrow_forward
- In Colorado, sales of medical marijuana began in November 2012; however, the Department of Revenue did not report tax collection data until February of 2014. The accompanying data file includes monthly revenue from medical and retail marijuana tax and fee collections as posted in the Colorado state accounting system. Use the linear trend model (no seasonality) to forecast the tax revenue for November and December of 2018. Date Revenue February/14 3,519,756 March/14 4,092,575 April/14 4,980,992 May/14 5,273,355 June/14 5,715,707 July/14 6,522,085 August/14 7,407,450 September/14 7,741,167 October/14 7,232,870 November/14 7,642,800 December/14 7,465,568 January/15 8,558,141 February/15 8,802,295 March/15 9,099,395 April/15 9,979,643 May/15 10,617,311 June/15 11,326,452 July/15 10,856,584 August/15 12,811,437 September/15 13,181,758 October/15 11,656,736 November/15 11,290,012 December/15 12,231,410 January/16 13,247,434 February/16…arrow_forwardThe National Entrepreneurship and Innovation Programme has initiated a business incubation venture ahead of schedule in the venture lifecycle. Something that must be done is to do a justification for the project. Since very little information is known about the project, the estimates are considered to be rough estimates. The accompanying table is the project manager’s gauge of the income that will occur throughout the following five years: End of Year Cash Flow In (GHC) Cash Flow Out (GHC) 1 0 500,000.00 2 300,000.00 90,000.00 3 400,000.00 100,000.00 4 100,000.00 175,000.00 5 50,000.00 35,000.00 What is the payback period for the project. show workings If the net present value (NPV) for each of the cash flows were calculated at a 10% interest rate, what would the NPV cash flow be at the end of five years? Comment on the feasibility of the project.arrow_forwardThe table below comes from EPI’s Family Budget Calculator which demonstrates the income a family needs in order to attain a modest yet adequate standard of living. Compared with the federal poverty line and the Supplemental Poverty Measure, EPI’s family budgets provide a more accurate and complete measure of economic security in America. MONTHLY COSTS 2 ADULTS AND 3 CHILDREN CLACKAMAS COUNTY,OR HOUSING $2,017 FOOD $982 CHILD CARE $1,953 TRANSPORTATION $1,282 HEALTH CARE $1,062 OTHER NECESSITIES $1,218 TAXES $2,126 MONTHLY TOTAL $10,632 a.Create a graph that shows this situation clearly.arrow_forward
arrow_back_ios
SEE MORE QUESTIONS
arrow_forward_ios
Recommended textbooks for you
 Glencoe Algebra 1, Student Edition, 9780079039897...AlgebraISBN:9780079039897Author:CarterPublisher:McGraw Hill
 Big Ideas Math A Bridge To Success Algebra 1: Stu...AlgebraISBN:9781680331141Author:HOUGHTON MIFFLIN HARCOURTPublisher:Houghton Mifflin Harcourt
 Holt Mcdougal Larson Pre-algebra: Student Edition...AlgebraISBN:9780547587776Author:HOLT MCDOUGALPublisher:HOLT MCDOUGAL
Glencoe Algebra 1, Student Edition, 9780079039897...
Algebra
ISBN:9780079039897
Author:Carter
Publisher:McGraw Hill
Big Ideas Math A Bridge To Success Algebra 1: Stu...
Algebra
ISBN:9781680331141
Author:HOUGHTON MIFFLIN HARCOURT
Publisher:Houghton Mifflin Harcourt
Holt Mcdougal Larson Pre-algebra: Student Edition...
Algebra
ISBN:9780547587776
Author:HOLT MCDOUGAL
Publisher:HOLT MCDOUGAL
Time Series Analysis Theory & Uni-variate Forecasting Techniques; Author: Analytics University;https://www.youtube.com/watch?v=_X5q9FYLGxM;License: Standard YouTube License, CC-BY
Operations management 101: Time-series, forecasting introduction; Author: Brandoz Foltz;https://www.youtube.com/watch?v=EaqZP36ool8;License: Standard YouTube License, CC-BY