
MATLAB: An Introduction with Applications
6th Edition
ISBN: 9781119256830
Author: Amos Gilat
Publisher: John Wiley & Sons Inc
expand_more
expand_more
format_list_bulleted
Related questions
Question
If all positions were paid equally, how much would Switzerland spend on wages for data processing in a year?
A) CHF 1.03 billion
B) CHF 3.45 billion
C) CHF 162.5 billion
D) CHF 103.9 billion
E) CHF 188.5 billion
Transcribed Image Text:Likelihood of industries becoming automated in the future Proportion of jobs and their risk of automation. Note: the graph shows a linear decrease in the proportion of jobs at risk of full automation. 60% 55% 50% 45% 40% 35% 30% 25% 20% 15% 10% 5% 0% LLL H Retail Waste Management Transportation and Storage Technical feasibility of job automation Likelihood of automating job tasks Predictable Physical Work Data Processing Data Collection Unpredictable Physical Work Stakeholder Interactions Applying Expertise with Clients Managing Others 0% Finance and Insurance Proportion of Jobs at Risk of Full Automation Employment Share of Total Jobs 5% 10% 15% Manufacturing 20% 25% 30% % of Tasks which could be Automated 35% Administration 40% 45% 50% 55% Electricity and Gas 60% 65% % of Time Spent on Tasks in all Swiss Occupations 70% Other 75% 80%
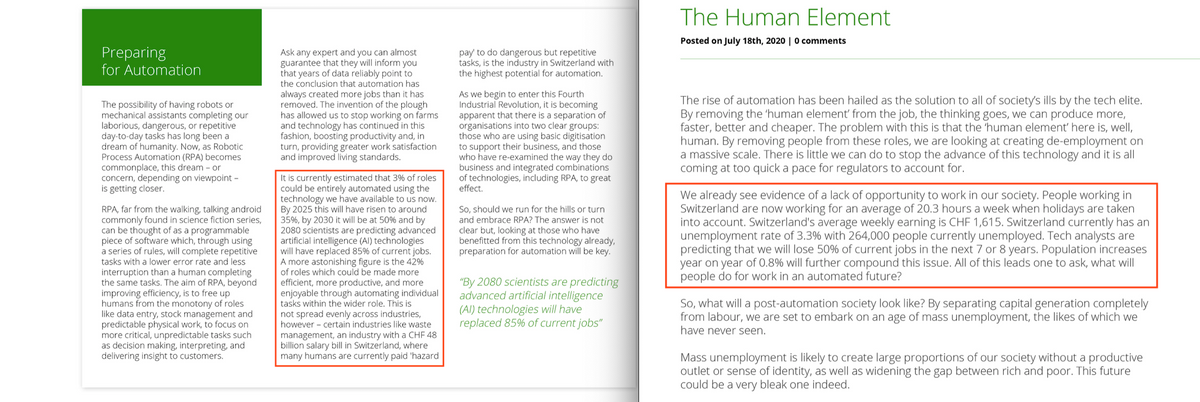

Transcribed Image Text:Preparing
for Automation
The possibility of having robots or
mechanical assistants completing our
laborious, dangerous, or repetitive
day-to-day tasks has long been a
dream of humanity. Now, as Robotic
Process Automation (RPA) becomes
commonplace, this dream - or
concern, depending on viewpoint-
is getting closer.
RPA, far from the walking, talking android
commonly found in science fiction series,
can be thought of as a programmable
piece of software which, through using
a series of rules, will complete repetitive
tasks with a lower error rate and less
interruption than a human completing
the same tasks. The aim of RPA, beyond
improving efficiency, is to free up
humans from the monotony of roles
like data entry, stock management and
predictable physical work, to focus on
more critical, unpredictable tasks such
as decision making, interpreting, and
delivering insight to customers.
Ask any expert and you can almost
guarantee that they will inform you
that years of data reliably point to
the conclusion that automation has
always created more jobs than it has
removed. The invention of the plough
has allowed us to stop working on farms
and technology has continued in this
fashion, boosting productivity and, in
turn, providing greater work satisfaction
and improved living standards.
It is currently estimated that 3% of roles
could be entirely automated using the
technology we have available to us now.
By 2025 this will have risen to around
35%, by 2030 it will be at 50% and by
2080 scientists are predicting advanced
artificial intelligence (Al) technologies
will have replaced 85% of current jobs.
A more astonishing figure is the 42%
of roles which could be made more
efficient, more productive, and more
enjoyable through automating individual
tasks within the wider role. This is
This is
not spread evenly across industries,
however-certain industries like waste
management, an industry with a CHF 48
billion salary bill in Switzerland, where
many humans are currently paid 'hazard
pay to do dangerous but repetitive
tasks, is the industry in Switzerland with
the highest potential for automation.
As we begin to enter this Fourth
Industrial Revolution, it is becoming
apparent that there is a separation of
organisations into two clear groups:
those who are using basic digitisation.
to support their business, and those
who have re-examined the way they do
business and integrated combinations
of technologies, including RPA, to great
effect.
So, should we run for the hills or turn
and embrace RPA? The answer is not
clear but, looking at those who have
benefitted from this technology already,
preparation for automation will be key
"By 2080 scientists are predicting
advanced artificial intelligence
(Al) technologies will have
replaced 85% of current jobs"
The Human Element
Posted on July 18th, 2020 | 0 comments
The rise of automation has been hailed as the solution to all of society's ills by the tech elite.
By removing the 'human element' from the job, the thinking goes, we can produce more,
faster, better and cheaper. The problem with this is that the human element' here is, well,
human. By removing people from these roles, we are looking at creating de-employment on
a massive scale. There is little we can do to stop the advance of this technology and it is all
coming at too quick a pace for regulators to account for.
We already see evidence of a lack of opportunity to work in our society. People working in
Switzerland are now working for an average of 20.3 hours a week when holidays are taken
into account. Switzerland's average weekly earning is CHF 1,615. Switzerland currently has an
unemployment rate of 3.3 % with 264,000 people currently unemployed. Tech analysts are
predicting that we will lose 50% of current jobs in the next 7 or 8 years. Population increases
year on year of 0.8% will further compound this issue. All of this leads one to ask, what will
people do for work in an automated future?
So, what will a post-automation society look like? By separating capital generation completely
from labour, we are set to embark on an age of mass unemployment, the likes of which we
have never seen.
Mass unemployment is likely to create large proportions of our society without a productive
outlet or sense of identity, as well as widening the gap between rich and poor. This future
could be a very bleak one indeed.

Transcribed Image Text:Likelihood of industries becoming automated in the future
Proportion of jobs and their risk of automation. Note: the graph shows a linear decrease in the proportion of jobs at risk of full automation.
60%
55%
50%
45%
40%
35%
30%
25%
20%
15%
10%
5%
0%
LLL666.0
Retail
Administration
Waste Management Transportation and Manufacturing
Storage
Technical feasibility of job automation
Likelihood of automating job tasks
Predictable
Physical
Work
Data
Processing
Data
Collection
Unpredictable
Physical
Work
Stakeholder
Interactions
Applying
Expertise
with
Clients
Managing
Others
0%
5%
10%
15%
Proportion of Jobs at Risk of Full Automation Employment Share of Total Jobs
20%
25%
30%
% of Tasks which could be Automated
35%
40%
45%
Finance and
50%
Insurance
Electricity and Gas
55%
60%
65%
% of Time Spent on Tasks in all Swiss Occupations
70%
Other
75%
80%
Expert Solution
This question has been solved!
Explore an expertly crafted, step-by-step solution for a thorough understanding of key concepts.

This is a popular solution

Trending nowThis is a popular solution!

Step by stepSolved in 3 steps with 1 images

Knowledge Booster

Similar questions
- A bank developed a model for predicting the average checking and savings account balance as balance=−18,438+317×age+1,240×years education+0.108×household wealth. a. Explain how to interpret the numbers in this model. b. Suppose that a customer is 27 years old, is a college graduate (so that years education=16),and has a household wealth of $130,000.What is the predicted bank balance?arrow_forwardChoose the correct answer. On Day 1 of a technology conference in San Diego, 15 presenters who were setting up for their sessions in Annex C became ill with flu-like symptoms. During the course of the conference, 20 participants who attended sessions in Annex C also became ill with the same symptoms. To begin calculating the rate of this outbreak, investigators should first determine A) the size of the conference population, B) the number of cases of illness, C) the number of days the conference was held, D) the location of the conference?arrow_forwardTotal DVD and Blu-ray disc sales in 2009 were $8.72 billion. For the purposes of this problem, you will combine DVD and Blue-ray disk sales into one category of DVD sales. A study by In-Stat predicted that "physical disc sales will decline by $4.7 billion by 2014," and that "streaming, on the other hand, should grow from its current $2.2 billion to $6.3 billion over the same time period (2009–2014). d. Write an equation that represents the linear model for streaming videos. Let S = the total sales of streaming videos in billions of dollars, and t = the number of years after 2009. e. In what year do the models predict streaming video sales to exceed DVD sales?arrow_forward
- An fruit grower knows from previous experience and careful data analysis that if the fruit on a specific kind of tree is harvested at this time of year, each tree will yield, on average, 127 pounds, and will sell for $4.6 per pound. However, for each additional week the harvest is delayed (up to a point), the yield per tree will increase by 2.1 pounds, while the price per pound will decrease by $0.07. A) How many weeks should the grower wait before harvesting the apples in order to maximize the sales revenue per tree? (Round your answer to the nearest tenth of a week.) Answer: __________ (rounded to the nearest tenth) B) Use your answer in part A to find the actual maximum revenue that can be expected. (Round your answer to the nearest dollar.) Answer: ____________ dollars (rounded to the nearest dollar)arrow_forwardStep 3: Assess the Evidence (Calculate the test statistic for the observed sample mean. Sketch the T-distribution and identify the position of the observed test statistic. Shade the area that represents the P-value. Use the test statistic to find the P-value.)arrow_forwardAn analyst in the real estate business is interested in the relationship between the cost of the monthly rent of an apartment and the size of an apartment, in big cities. She gathers data for apartment buildings in 12 cities in 12 different states. In each city, she gets the numbers for at least 5 different buildings and at least 40 apartments in each building. She reaches the following conclusion: the rental cost of a 2-bedroom apartment is 50% more than the rental cost of a 1-bedroom apartment, and the rental cost of a 3-bedroom apartment is 50% more than the rental cost of a 2-bedroom apartment. Based on the paragraph, what is the minimum number of apartments she collected data on? Do you think her sample was large enough to be statistically valid? Based on the paragraph, are there any apartments or apartment buildings that she would have excluded from her study? Do you see any bias in how she selected apartments for her study? Based on the paragraph, is there a positive…arrow_forward
- 5 Imagine that a company sells portable walkie-talkie radios to construction crews. The batteries for these radios last for an average of 55 hours. The purchasing manager for this company receives a brochure in the mail that advertises a new brand of batteries. This new brand of batteries is cheaper than the brand that the company currently uses. However, the purchasing manager is concerned that the cheaper batteries may have a shorter average battery life than the current brand. (Note: The number of hours that batteries last is called their battery life.) The pricing manager installs 40 randomly selected batteries of the cheaper brand in the company's walkie-talkie radios. He finds that the mean battery life for the sample is 52 hours, with a standard deviation of 10 hours. He wants to perform a statistical test at the 1% level of significance to determine whether the cheaper batteries have a shorter average battery life span than the average life span of the brand of batteries the…arrow_forward1. Referring to Scenario 13-11, which of the following is the correct interpretation for the slope coefficient?a) For each decrease of 1 thousand downloads, the expected revenue is estimated to increase by $ 3.7297 thousands.b) For each increase of 1 thousand downloads, the expected revenue is estimated to increase by $ 3.7297 thousands.c) For each decrease of 1 thousand dollars in expected revenue, the expected number of downloads is estimated to increase by 3.7297 thousands.d) For each increase of 1 thousand dollars in expected revenue, the expected number of downloads is estimated to increase by 3.7297 thousands.arrow_forward
arrow_back_ios
arrow_forward_ios
Recommended textbooks for you
- MATLAB: An Introduction with ApplicationsStatisticsISBN:9781119256830Author:Amos GilatPublisher:John Wiley & Sons Inc
 Probability and Statistics for Engineering and th...StatisticsISBN:9781305251809Author:Jay L. DevorePublisher:Cengage Learning
 Statistics for The Behavioral Sciences (MindTap C...StatisticsISBN:9781305504912Author:Frederick J Gravetter, Larry B. WallnauPublisher:Cengage Learning
  Elementary Statistics: Picturing the World (7th E...StatisticsISBN:9780134683416Author:Ron Larson, Betsy FarberPublisher:PEARSON
 The Basic Practice of StatisticsStatisticsISBN:9781319042578Author:David S. Moore, William I. Notz, Michael A. FlignerPublisher:W. H. Freeman
 Introduction to the Practice of StatisticsStatisticsISBN:9781319013387Author:David S. Moore, George P. McCabe, Bruce A. CraigPublisher:W. H. Freeman
MATLAB: An Introduction with Applications
Statistics
ISBN:9781119256830
Author:Amos Gilat
Publisher:John Wiley & Sons Inc
Probability and Statistics for Engineering and th...
Statistics
ISBN:9781305251809
Author:Jay L. Devore
Publisher:Cengage Learning
Statistics for The Behavioral Sciences (MindTap C...
Statistics
ISBN:9781305504912
Author:Frederick J Gravetter, Larry B. Wallnau
Publisher:Cengage Learning
Elementary Statistics: Picturing the World (7th E...
Statistics
ISBN:9780134683416
Author:Ron Larson, Betsy Farber
Publisher:PEARSON
The Basic Practice of Statistics
Statistics
ISBN:9781319042578
Author:David S. Moore, William I. Notz, Michael A. Fligner
Publisher:W. H. Freeman
Introduction to the Practice of Statistics
Statistics
ISBN:9781319013387
Author:David S. Moore, George P. McCabe, Bruce A. Craig
Publisher:W. H. Freeman