MATLAB: An Introduction with Applications
6th Edition
ISBN: 9781119256830
Author: Amos Gilat
Publisher: John Wiley & Sons Inc
expand_more
expand_more
format_list_bulleted
Concept explainers
Question
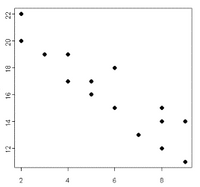
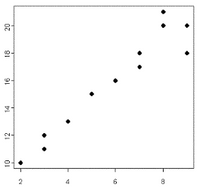
Write a mathematical scenario to describe each of the

Transcribed Image Text:91
22

Transcribed Image Text:2
8
81
01
12
Expert Solution
This question has been solved!
Explore an expertly crafted, step-by-step solution for a thorough understanding of key concepts.
This is a popular solution
Trending nowThis is a popular solution!
Step by stepSolved in 2 steps

Knowledge Booster
Learn more about
Need a deep-dive on the concept behind this application? Look no further. Learn more about this topic, statistics and related others by exploring similar questions and additional content below.Similar questions
- Twelve husbands were asked how much housework they completed last week and how many children were in the home. Use the following data to complete the questions in this section. Write out the linear model. Children Husband’s Housework Children Husband’s Housework 2 4 4 6 1 1 1 3 3 0 3 5 5 4 2 3 1 5 2 1 5 7 4 3arrow_forwardThe data to the right shows the number of graduating students with business majors at a university over the last 15 years. 277 269 263 256 247 241 236 230 224 214 208 202 a. Construct a box-and-whisker plot for this data. b. Identify the five-number summary. 197 187 182 斯 a) Choose the correct box-and-whisker plot of the data below. C. O B. OA. 150 200 250 300 150 200 250 300 150 200 250 300 b) The five-number summary is (Use ascending order.)arrow_forwardTwenty salesmen were asked how many phone calls they made on a givan day. The data was ecorded in the table balow. Construct a dot plot for the sat. 15 12 0 1 2 3 4 5 0 1 2 3 4 5 0 1 2 3 4 5 0 1 2 34 5arrow_forward
- Homework Q1: Implement All plot types using MS Excel and Send the files Q2: What type of plot is most suitable to address the electromagnetic spectrum and why? Report Write a report about using plots for manufacturing of One of these types • • Lasers Light Emitting Diodes • Optical Switches 22arrow_forwardObjective: Students will be able to 1) Create a box-and-whisker plot, 2) Interpret a box-and-whisker plot, and Identify cumulative frequency. How do I interpret a box-and-whisker plot? I 1. What does the x-axis show? Boys 2. What does the y-axis represent? 3. What does the length of Girls each of the lines (red and green) mean? 4. Does the size of the box 2. 8 10 12 14 16 18 20 22 24 Time (s) matter? How to create a box-and-whisker plot: To draw a box-and-whisker plot you need five pieces of information, called the five-number summary: the smallest value, the lower quartile (LQ), the median, the upper quartile (U0) and the largest value. An outlier is a value that is much smaller or much larger than the other values. An outlier is a point less than the LQ-1.5x 1QR or greater than the UQ+1.5xIQR.arrow_forwardExamine both dot plots. Determine which number is an outlier A. 2 B. 4 C. 12 D. 14arrow_forward
- A high school has 44 players on the football team. The summary of the players' weights is given in the box plot. Approximately, what is the percentage of players weighing greater than or equal to 245 pounds? 191 217 245 164 262 - 0o 150 160 170 180 190 200 210 220 230 240 250 260 270 00 Weight unds) Answer E Tables E Keypad Keyboard Shortcuts % Submit Answer © 2022 Hawkes Learningarrow_forwardRaul and his Sister, Francesca, helped cook dinner. The following dot plots show how many times they helped cooked dinner each week over the last 15 weeks. Number of Times Francesca Helped Cook Number of Times Raul Helped Cook ++ 10 Number of Dinners Number of Dinners I. The interquartile range of the number of dinners Raul helped cook is greater than the interquartile range of the number of dinners Francesca helped cook. II. The distribution of the data is approximately symmetrical for both data sets. II. The mode of the number of dinners Raul helped cook is greater than the mode of the number of dinners Francesca helped cook. Which statement(s) are true? O A. only II O B. only II O C. only II and II O D only I and IIIarrow_forward
arrow_back_ios
arrow_forward_ios
Recommended textbooks for you
 MATLAB: An Introduction with ApplicationsStatisticsISBN:9781119256830Author:Amos GilatPublisher:John Wiley & Sons Inc
 Probability and Statistics for Engineering and th...StatisticsISBN:9781305251809Author:Jay L. DevorePublisher:Cengage Learning
 Statistics for The Behavioral Sciences (MindTap C...StatisticsISBN:9781305504912Author:Frederick J Gravetter, Larry B. WallnauPublisher:Cengage Learning
 Elementary Statistics: Picturing the World (7th E...StatisticsISBN:9780134683416Author:Ron Larson, Betsy FarberPublisher:PEARSON
 The Basic Practice of StatisticsStatisticsISBN:9781319042578Author:David S. Moore, William I. Notz, Michael A. FlignerPublisher:W. H. Freeman
 Introduction to the Practice of StatisticsStatisticsISBN:9781319013387Author:David S. Moore, George P. McCabe, Bruce A. CraigPublisher:W. H. Freeman

MATLAB: An Introduction with Applications
Statistics
ISBN:9781119256830
Author:Amos Gilat
Publisher:John Wiley & Sons Inc

Probability and Statistics for Engineering and th...
Statistics
ISBN:9781305251809
Author:Jay L. Devore
Publisher:Cengage Learning

Statistics for The Behavioral Sciences (MindTap C...
Statistics
ISBN:9781305504912
Author:Frederick J Gravetter, Larry B. Wallnau
Publisher:Cengage Learning

Elementary Statistics: Picturing the World (7th E...
Statistics
ISBN:9780134683416
Author:Ron Larson, Betsy Farber
Publisher:PEARSON

The Basic Practice of Statistics
Statistics
ISBN:9781319042578
Author:David S. Moore, William I. Notz, Michael A. Fligner
Publisher:W. H. Freeman

Introduction to the Practice of Statistics
Statistics
ISBN:9781319013387
Author:David S. Moore, George P. McCabe, Bruce A. Craig
Publisher:W. H. Freeman