
a.
To Sketch: The graphs of
Given:
The graphs of
Explanation:
The graphical representation of
It appears that the two graphs can be divided into five regions based on the
five points have been plotted so that one point lies within each of these regions:
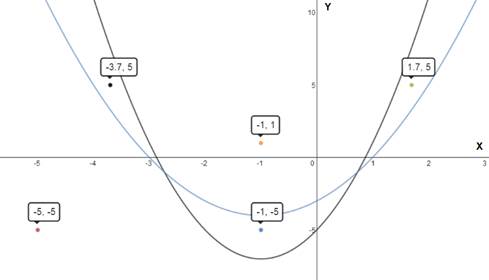
All points in a region will satisfy the inequality if a point in it satisfies it.
Check the points which satisfy
Take the point
The inequality satisfied.
Take the point
The inequality satisfied.
Take the point
The inequality does not satisfy.
Take the point
The inequality does not satisfy.
Take the point
The inequality does not satisfy.
The points which do not satisfy the Inequality
Check for the points which satisfy
Take the point
The inequality satisfied.
Take the point
The inequality does not satisfy.
Take the point
The inequality does not satisfy.
Take the point
The inequality satisfied.
Take the point
The inequality satisfied.
The points which do not satisfy the Inequality
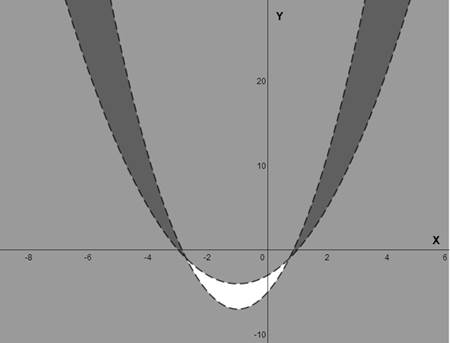
Find the Inequalities whose solutions are the points in two non-overlapping regions:
The Inequalities are:
So, the pair of required inequalities are:
The graphical representation is:
b.
To Sketch: The graphs of
Given:
The graphs of
Explanation:
The graphical representation of
It appears that the two graphs can be divided into five regions based on the
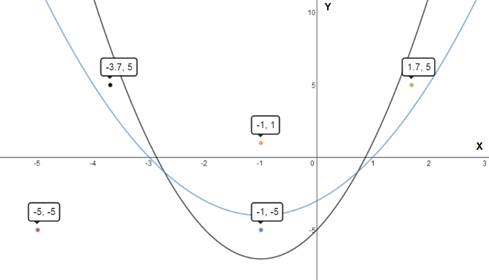
All points in a region will satisfy the inequality if a point in it satisfies it.
Check the points which satisfy
Take the point
The inequality satisfied.
Take the point
The inequality satisfied.
Take the point
The inequality does not satisfy.
Take the point
The inequality does not satisfy.
Take the point
The inequality does not satisfy.
The points which do not satisfy the Inequality
Check for the points which satisfy
Take the point
The inequality satisfied.
Take the point
The inequality does not satisfy.
Take the point
The inequality does not satisfy.
Take the point
The inequality satisfied.
Take the point
The inequality satisfied.
The points which do not satisfy the Inequality
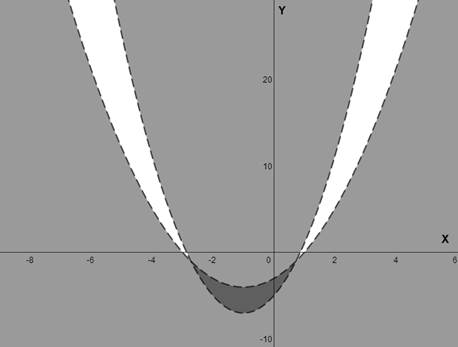
Find the Inequalities whose solutions are the points in a bounded region:
From the figure, the only Bounded Region is which has the points
From above, the Inequalities are:
So, the needed pair of inequalities are:
The graphical representation is:
Chapter 4 Solutions
High School Math 2015 Common Core Algebra 2 Student Edition Grades 10/11

 Algebra and Trigonometry (6th Edition)AlgebraISBN:9780134463216Author:Robert F. BlitzerPublisher:PEARSON
 Contemporary Abstract AlgebraAlgebraISBN:9781305657960Author:Joseph GallianPublisher:Cengage Learning
 Linear Algebra: A Modern IntroductionAlgebraISBN:9781285463247Author:David PoolePublisher:Cengage Learning
 Algebra And Trigonometry (11th Edition)AlgebraISBN:9780135163078Author:Michael SullivanPublisher:PEARSON
 Introduction to Linear Algebra, Fifth EditionAlgebraISBN:9780980232776Author:Gilbert StrangPublisher:Wellesley-Cambridge Press
 College Algebra (Collegiate Math)AlgebraISBN:9780077836344Author:Julie Miller, Donna GerkenPublisher:McGraw-Hill Education