
Videos
a.
To create: A
a.
Explanation of Solution
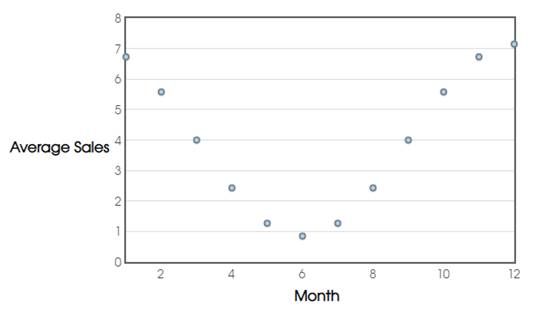
Given Information: Relevant data values arranged in table.
Graph:
b.
To find: A trigonometric model that fits the data and to graph the model on scatter plot and then to determine how well the model fits the data.
b.
Answer to Problem 69E
The model
Explanation of Solution
Given Information: A relevant table and scatter plot from previous part.
Calculation:
Scatter plot appeared sinusoidal; using sinusoidal regression feature of graphing calculator,
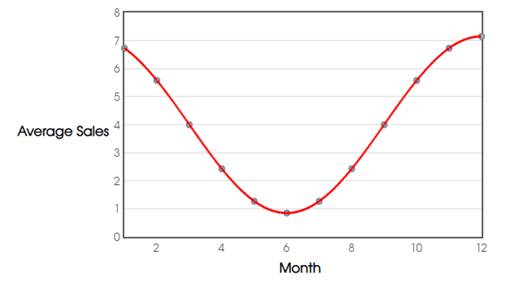
Points lie on equation’s graph, this implies that model fits the data very accurately.
Thus, the model
c.
To find: The period of the model and explain if it is reasonable given the context.
c.
Answer to Problem 69E
Period of
Explanation of Solution
Given Information: Data is about outerwear sales.
Calculation:
Period is about
Thus, period of
d.
To interpret: The meaning of model’s amplitude in the context of the problem.
d.
Answer to Problem 69E
Amplitude implies that greatest average sales are
Explanation of Solution
Given Information: Data is about outerwear sales, model from one of the previous parts.
Calculation:
The value of amplitude is about
Thus, amplitude implies that greatest average sales are
Chapter 4 Solutions
Precalculus with Limits: A Graphing Approach


 Calculus: Early TranscendentalsCalculusISBN:9781285741550Author:James StewartPublisher:Cengage Learning
 Thomas' Calculus (14th Edition)CalculusISBN:9780134438986Author:Joel R. Hass, Christopher E. Heil, Maurice D. WeirPublisher:PEARSON
 Calculus: Early Transcendentals (3rd Edition)CalculusISBN:9780134763644Author:William L. Briggs, Lyle Cochran, Bernard Gillett, Eric SchulzPublisher:PEARSON
 Calculus: Early TranscendentalsCalculusISBN:9781319050740Author:Jon Rogawski, Colin Adams, Robert FranzosaPublisher:W. H. Freeman
 Calculus: Early Transcendental FunctionsCalculusISBN:9781337552516Author:Ron Larson, Bruce H. EdwardsPublisher:Cengage Learning