Concept explainers
(a)
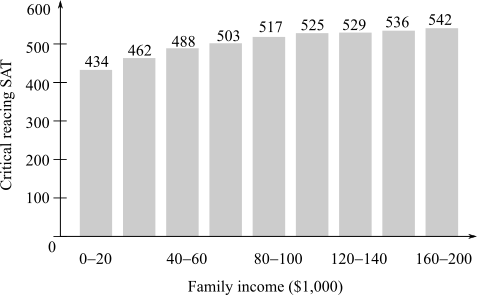
The correct option that models the data in the graph showing math SAT scores as a function of household income where C is a constant out of the following options.

A) S(x)=C−133e−0.0131x
B) S(x)=C+133e−0.0131x
C) S(x)=C+133e0.0131x
D) S(x)=C−133e0.0131x
Where S(x) is the average math SAT score of students with household income x in thousand dollars per year.
(b)
The prediction for the effect on the math SAT score of the student if the income of parents earning $45000 is increased by a $1000 using S′(x) Where S(x) is the average math SAT score of students with household income x in thousand dollars per year.

(c)
Whether S′(x) is increasing or decreasing as x increases and also interpret the result if S(x) is the average math SAT score of students with household income x in thousand dollars per year and the graph shows math SAT scores as a function of household income where C is a constant.

Want to see the full answer?
Check out a sample textbook solution
Chapter 4 Solutions
Applied Calculus
- question 10 pleasearrow_forward00 (a) Starting with the geometric series Σ X^, find the sum of the series n = 0 00 Σηχη - 1, |x| < 1. n = 1 (b) Find the sum of each of the following series. 00 Σnx", n = 1 |x| < 1 (ii) n = 1 sin (c) Find the sum of each of the following series. (i) 00 Σn(n-1)x^, |x| <1 n = 2 (ii) 00 n = 2 n² - n 4n (iii) M8 n = 1 շոarrow_forward(a) Use differentiation to find a power series representation for 1 f(x) = (4 + x)²* f(x) = 00 Σ n = 0 What is the radius of convergence, R? R = (b) Use part (a) to find a power series for f(x) = 1 (4 + x)³° f(x) = 00 Σ n = 0 What is the radius of convergence, R? R = (c) Use part (b) to find a power series for f(x) = x² (4 + x)³* 00 f(x) = Σ n = 2 What is the radius of convergence, R? R = Need Help? Read It Watch It SUBMIT ANSWERarrow_forward
- answer for question 4 pleasearrow_forward(3) (20 points) Let F(x, y, z) = (y, z, x²z). Define E = {(x, y, z) | x² + y² ≤ z ≤ 1, x ≤ 0}. (a) (2 points) Calculate the divergence V. F. (b) (4 points) Let D = {(x, y) | x² + y² ≤ 1, x ≤ 0} Without calculation, show that the triple integral √ (V · F) dV = √ 2²(1. = x²(1 − x² - y²) dA. Earrow_forward(2) (22 points) Let F(x, y, z) = (x sin y, cos y, ―xy). (a) (2 points) Calculate V. F. (b) (6 points) Given a vector field is everywhere defined with V G₁(x, y, z) = * G2(x, y, z) = − G3(x, y, z) = 0. 0 0 F(x, y, z) = (F₁(x, y, z), F₂(x, y, z), F(x, y, z)) that F = 0, let G = (G1, G2, G3) where F₂(x, y, y, t) dt - √ F³(x, t, 0) dt, * F1(x, y, t) dt, t) dt - √ F Calculate G for the vector field F(x, y, z) = (x sin y, cos y, -xy).arrow_forward
- Evaluate the following integral over the Region R. (Answer accurate to 2 decimal places). √ √(x + y) A R R = {(x, y) | 25 < x² + y² ≤ 36, x < 0} Hint: The integral and Region is defined in rectangular coordinates.arrow_forwardFind the volume of the solid that lies under the paraboloid z = 81 - x² - y² and within the cylinder (x − 1)² + y² = 1. A plot of an example of a similar solid is shown below. (Answer accurate to 2 decimal places). Volume using Double Integral Paraboloid & Cylinder -3 Hint: The integral and region is defined in polar coordinates.arrow_forwardEvaluate the following integral over the Region R. (Answer accurate to 2 decimal places). √4(1–2² 4(1 - x² - y²) dA R 3 R = {(r,0) | 0 ≤ r≤ 2,0π ≤0≤¼˜}. Hint: The integral is defined in rectangular coordinates. The Region is defined in polar coordinates.arrow_forward
- Evaluate the following integral over the Region R. (Answer accurate to 2 decimal places). R - 1 · {(r,0) | 1 ≤ r≤ 5,½π≤ 0<1π}. Hint: Be sure to convert to Polar coordinates. Use the correct differential for Polar Coordinates.arrow_forwardEvaluate the following integral over the Region R. (Answer accurate to 2 decimal places). √ √2(x+y) dA R R = {(x, y) | 4 < x² + y² < 25,0 < x} Hint: The integral and Region is defined in rectangular coordinates.arrow_forwardHW: The frame shown in the figure is pinned at A and C. Use moment distribution method, with and without modifications, to draw NFD, SFD, and BMD. B I I 40 kN/m A 3 m 4 marrow_forward
 College AlgebraAlgebraISBN:9781305115545Author:James Stewart, Lothar Redlin, Saleem WatsonPublisher:Cengage Learning
 Algebra & Trigonometry with Analytic GeometryAlgebraISBN:9781133382119Author:SwokowskiPublisher:Cengage
 Big Ideas Math A Bridge To Success Algebra 1: Stu...AlgebraISBN:9781680331141Author:HOUGHTON MIFFLIN HARCOURTPublisher:Houghton Mifflin Harcourt
 Functions and Change: A Modeling Approach to Coll...AlgebraISBN:9781337111348Author:Bruce Crauder, Benny Evans, Alan NoellPublisher:Cengage Learning
 Algebra and Trigonometry (MindTap Course List)AlgebraISBN:9781305071742Author:James Stewart, Lothar Redlin, Saleem WatsonPublisher:Cengage Learning


