
Concept explainers
Videos
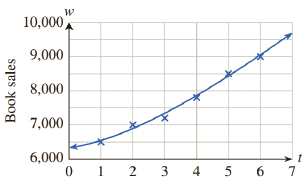
Sales OHaganBooks.com fits the cubic curve
to its weekly sales figures (see Chapter 3 Review Exercise 57; t is time in weeks), as shown in the following graph:
Week
a. According to the cubic model, what was the rate of increase of sales at the beginning of the second week
b. If we extrapolate the model, what would be the rate of increase of weekly sales at the beginning of the eighth week
c. Graph the function w for
d. By examining the graph, say why the choice of a quadratic model would result in radically different long- term predictions of sales.
Want to see the full answer?
Check out a sample textbook solution
Chapter 4 Solutions
Applied Calculus


 Glencoe Algebra 1, Student Edition, 9780079039897...AlgebraISBN:9780079039897Author:CarterPublisher:McGraw Hill
 College Algebra (MindTap Course List)AlgebraISBN:9781305652231Author:R. David Gustafson, Jeff HughesPublisher:Cengage Learning
 Algebra & Trigonometry with Analytic GeometryAlgebraISBN:9781133382119Author:SwokowskiPublisher:Cengage
 Trigonometry (MindTap Course List)TrigonometryISBN:9781337278461Author:Ron LarsonPublisher:Cengage Learning
 Algebra and Trigonometry (MindTap Course List)AlgebraISBN:9781305071742Author:James Stewart, Lothar Redlin, Saleem WatsonPublisher:Cengage Learning