
Videos
To describe and correct the error in interpreting the graphing calculator display -
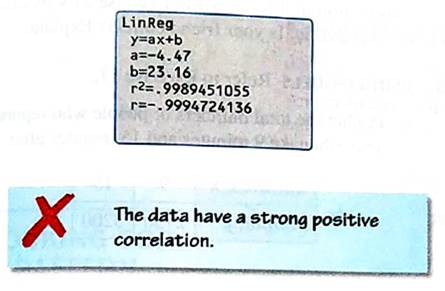
Answer to Problem 16E
The data have a strong
Explanation of Solution
Given:

Formula Used:
Correlation is Positive when the values increase or decrease together, and- Correlation is Negative when one value decreases as the other increases
- There is no correlation whenthe values don't seem linked at all.
A perfect negative correlation is represented by the value -1, a 0 indicates no correlation, and a +1 indicates a perfect
Calculation:
Given is −

As per the given values, we have:
As per the above definition of positive and negative correlation, we have:
A perfect negative correlation is represented by the value -1, a 0 indicates no correlation, and a +1 indicates a perfect positive correlation.
Since, the value of
Thus, the data have a strong negative correlation.
Conclusion:
The data have a strong negative correlation.
Chapter 4 Solutions
BIG IDEAS MATH Integrated Math 1: Student Edition 2016


 Discrete Mathematics and Its Applications ( 8th I...MathISBN:9781259676512Author:Kenneth H RosenPublisher:McGraw-Hill Education
 Mathematics for Elementary Teachers with Activiti...MathISBN:9780134392790Author:Beckmann, SybillaPublisher:PEARSON
 Thinking Mathematically (7th Edition)MathISBN:9780134683713Author:Robert F. BlitzerPublisher:PEARSON
 Discrete Mathematics With ApplicationsMathISBN:9781337694193Author:EPP, Susanna S.Publisher:Cengage Learning,
 Pathways To Math Literacy (looseleaf)MathISBN:9781259985607Author:David Sobecki Professor, Brian A. MercerPublisher:McGraw-Hill Education