
Concept explainers
Videos
To describe: two ways to graph the equation
Answer to Problem 36E
The two ways graph equation was drawn.
Explanation of Solution
Given:
Calculation:
Consider the point
One way to represent the function is to write the equation
So, use the
Now, put value
Multiply by 5 on both sides
Subtract by 25 on both sides
Therefore, the equation for function is
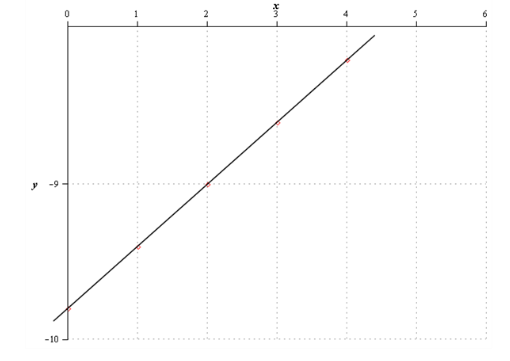
Second way to represent the function is draw the graph.
Put the different values for x in the equation and finds the corresponding value for the variable y . So, the find the data set for the equation and make the table
| x | 0 | 1 | 2 | 3 | 4 |
| y | -9.8 | -9.4 | -9 | -8.6 | -8.2 |
Now, draw the graph using data set
Conclusion:
Therefore, the two ways graph equation was drawn.
Chapter 4 Solutions
BIG IDEAS MATH Integrated Math 1: Student Edition 2016


 Discrete Mathematics and Its Applications ( 8th I...MathISBN:9781259676512Author:Kenneth H RosenPublisher:McGraw-Hill Education
 Mathematics for Elementary Teachers with Activiti...MathISBN:9780134392790Author:Beckmann, SybillaPublisher:PEARSON
 Thinking Mathematically (7th Edition)MathISBN:9780134683713Author:Robert F. BlitzerPublisher:PEARSON
 Discrete Mathematics With ApplicationsMathISBN:9781337694193Author:EPP, Susanna S.Publisher:Cengage Learning,
 Pathways To Math Literacy (looseleaf)MathISBN:9781259985607Author:David Sobecki Professor, Brian A. MercerPublisher:McGraw-Hill Education