
a.
Graph of the model
The solution is shown in the table.
Given information:
The amount of y of the oil collected by a petroleum company drilling on the U.S the equation is
Concept Used:
Write equation and raw the graph.
Explanation:
Graph As per the given problem.
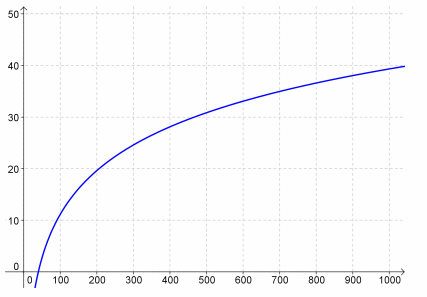
Conclusion:
Hence, the graph is drawn in the explanation.
b.
How many barrels of oil would expect to collect after drilling
Given information:
The amount of y of the oil collected by a petroleum company drilling on the U.S the equation is
Concept Used:
Substitute
Calculation:
As per the given problem
Substitute
Therefore,
Conclusion:
Hence, the. barrels of oil is
c.
How much well need to be drilled to collect
Given information:
The amount of y of the oil collected by a petroleum company drilling on the U.S the equation is
Concept Used:
Substitute
Calculation:
As per the given problem
Substitute
Therefore,
Conclusion:
Hence, the.
Chapter 4 Solutions
Holt Mcdougal Larson Algebra 2: Student Edition 2012

 Algebra and Trigonometry (6th Edition)AlgebraISBN:9780134463216Author:Robert F. BlitzerPublisher:PEARSON
 Contemporary Abstract AlgebraAlgebraISBN:9781305657960Author:Joseph GallianPublisher:Cengage Learning
 Linear Algebra: A Modern IntroductionAlgebraISBN:9781285463247Author:David PoolePublisher:Cengage Learning
 Algebra And Trigonometry (11th Edition)AlgebraISBN:9780135163078Author:Michael SullivanPublisher:PEARSON
 Introduction to Linear Algebra, Fifth EditionAlgebraISBN:9780980232776Author:Gilbert StrangPublisher:Wellesley-Cambridge Press
 College Algebra (Collegiate Math)AlgebraISBN:9780077836344Author:Julie Miller, Donna GerkenPublisher:McGraw-Hill Education