
Concept explainers
Videos
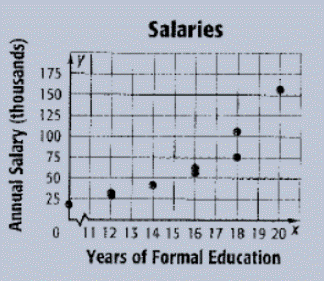
Whether the graph shown between annual salary (thousands) and years of formal education shows the positive, negative or no
Answer to Problem 6PPS
It shows negative correlation.
Explanation of Solution
Given information: The given graph is shown as:

Calculation: From the graph as the years of formal education increases, the annual salary in thousands also increases. Therefore, there is a
Chapter 4 Solutions
Glencoe Algebra 1, Student Edition, 9780079039897, 0079039898, 2018
Additional Math Textbook Solutions
College Algebra in Context with Applications for the Managerial, Life, and Social Sciences (5th Edition)
College Algebra (5th Edition)
College Algebra (10th Edition)
Linear Algebra and Its Applications (5th Edition)
Linear Algebra with Applications (2-Download)
Intermediate Algebra (7th Edition)


 Algebra and Trigonometry (6th Edition)AlgebraISBN:9780134463216Author:Robert F. BlitzerPublisher:PEARSON
 Contemporary Abstract AlgebraAlgebraISBN:9781305657960Author:Joseph GallianPublisher:Cengage Learning
 Linear Algebra: A Modern IntroductionAlgebraISBN:9781285463247Author:David PoolePublisher:Cengage Learning
 Algebra And Trigonometry (11th Edition)AlgebraISBN:9780135163078Author:Michael SullivanPublisher:PEARSON
 Introduction to Linear Algebra, Fifth EditionAlgebraISBN:9780980232776Author:Gilbert StrangPublisher:Wellesley-Cambridge Press
 College Algebra (Collegiate Math)AlgebraISBN:9780077836344Author:Julie Miller, Donna GerkenPublisher:McGraw-Hill Education