
Concept explainers
Videos
To find graph shows a positive,negative or no
Answer to Problem 41SGR
Explanation of Solution
Given information:The data where x represents the average high temperature andy represents the number of outside hours.
Let x be average high temperature.
| Temperature(f) x | 78 | 70 | 64 | 48 | 36 |
| Number of outside hours y | 94 | 75 | 60 | 34 | 20 |
Calculation:
Use a graphing calculator for above table,
Line of Best Fit
Graph of the equation is given below.
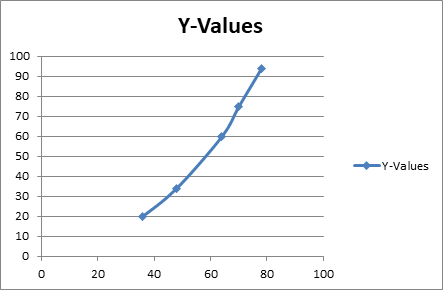
Wherex -axis represent temperature and y -axis number of outside hours.
It is clear from the graph, the temperature increase as the number of outside hoursincreases. The line of best fit for this datahas a positive slope so there is positive correlation.
Chapter 4 Solutions
Glencoe Algebra 1, Student Edition, 9780079039897, 0079039898, 2018
Additional Math Textbook Solutions
College Algebra with Modeling & Visualization (6th Edition)
Elementary Algebra: Concepts and Applications (10th Edition)
College Algebra
Algebra and Trigonometry
Graphical Approach To College Algebra
Differential Equations and Linear Algebra (4th Edition)


 Algebra and Trigonometry (6th Edition)AlgebraISBN:9780134463216Author:Robert F. BlitzerPublisher:PEARSON
 Contemporary Abstract AlgebraAlgebraISBN:9781305657960Author:Joseph GallianPublisher:Cengage Learning
 Linear Algebra: A Modern IntroductionAlgebraISBN:9781285463247Author:David PoolePublisher:Cengage Learning
 Algebra And Trigonometry (11th Edition)AlgebraISBN:9780135163078Author:Michael SullivanPublisher:PEARSON
 Introduction to Linear Algebra, Fifth EditionAlgebraISBN:9780980232776Author:Gilbert StrangPublisher:Wellesley-Cambridge Press
 College Algebra (Collegiate Math)AlgebraISBN:9780077836344Author:Julie Miller, Donna GerkenPublisher:McGraw-Hill Education