
Videos
a.
If the graph shows a positive, negative or no
a.
Explanation of Solution
Given information:
The table shows the median age of females when they were first married.
| Year | Age |
| 2001 | 25.1 |
| 2002 | 25.3 |
| 2003 | 25.3 |
| 2004 | 25.3 |
| 2005 | 25.5 |
| 2006 | 25.9 |
| 2007 | 26 |
| 2008 | 26.2 |
| 2009 | 26.5 |
| 2010 | 26.7 |
| 2011 | 26.9 |
Calculations:
Here the graph of year versus age is drawn.
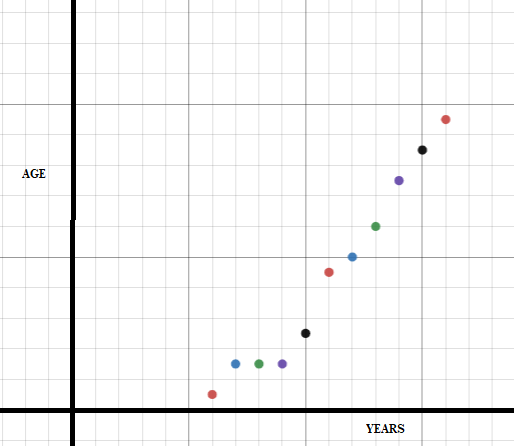
Here the graph shows a
b.
A line of fit for the scatter plot.
b.
Explanation of Solution
Given information:
The table shows the median age of females when they were first married.
| Year | Age |
| 2001 | 25.1 |
| 2002 | 25.3 |
| 2003 | 25.3 |
| 2004 | 25.3 |
| 2005 | 25.5 |
| 2006 | 25.9 |
| 2007 | 26 |
| 2008 | 26.2 |
| 2009 | 26.5 |
| 2010 | 26.7 |
| 2011 | 26.9 |
Calculations:
Here the graph of year versus age is drawn.
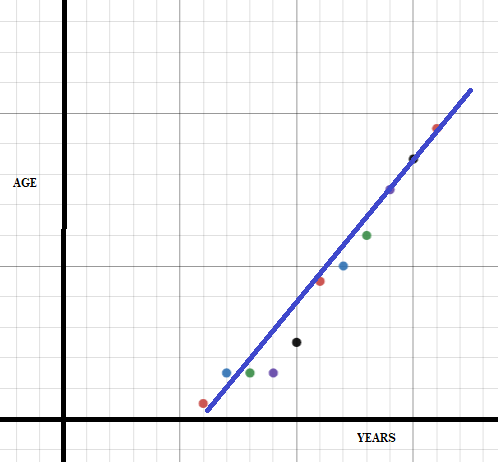
Here the graph shows a positive correlation. In the graph of positive correlation, as the X-parameter increases, the Y-parameter also increases. Here in this graph the age is shown in X-axis and year is shown in Y-axis. So as the year increases the age also increases. So the graph shows a positive correlation. Here line of fit for the scatter plot is drawn.
c.
An equation in slope intercept form for the line in fit.
c.
Explanation of Solution
Given information:
The table shows the median age of females when they were first married.
| Year | Age |
| 2001 | 25.1 |
| 2002 | 25.3 |
| 2003 | 25.3 |
| 2004 | 25.3 |
| 2005 | 25.5 |
| 2006 | 25.9 |
| 2007 | 26 |
| 2008 | 26.2 |
| 2009 | 26.5 |
| 2010 | 26.7 |
| 2011 | 26.9 |
Calculations:
Here the graph of year versus age is drawn.

Here the graph shows a positive correlation. In the graph of positive correlation, as the X-parameter increases, the Y-parameter also increases. Here in this graph the age is shown in X-axis and year is shown in Y-axis. So as the year increases the age also increases. So the graph shows a positive correlation. Here line of fit for the scatter plot is drawn.
Equation of the line of line in fit is,
So the equation is
d.
The median age of females when they are first married in the year
d.
Explanation of Solution
Given information:
The table shows the median age of females when they were first married.
| Year | Age |
| 2001 | 25.1 |
| 2002 | 25.3 |
| 2003 | 25.3 |
| 2004 | 25.3 |
| 2005 | 25.5 |
| 2006 | 25.9 |
| 2007 | 26 |
| 2008 | 26.2 |
| 2009 | 26.5 |
| 2010 | 26.7 |
| 2011 | 26.9 |
Calculations:
Here the graph of year versus age is drawn.

Here the graph shows a positive correlation. Here line of fit for the scatter plot is drawn.
Equation of the line of line in fit is,
So the equation is
Now to get the age of females in year
Thus,
Thus the median age of females when they are first married in the year
Chapter 4 Solutions
Algebra 1, Homework Practice Workbook (MERRILL ALGEBRA 1)
Additional Math Textbook Solutions
College Algebra (7th Edition)
College Algebra
Linear Algebra and Its Applications (5th Edition)
College Algebra
University Calculus: Early Transcendentals (3rd Edition)


 Algebra and Trigonometry (6th Edition)AlgebraISBN:9780134463216Author:Robert F. BlitzerPublisher:PEARSON
 Contemporary Abstract AlgebraAlgebraISBN:9781305657960Author:Joseph GallianPublisher:Cengage Learning
 Linear Algebra: A Modern IntroductionAlgebraISBN:9781285463247Author:David PoolePublisher:Cengage Learning
 Algebra And Trigonometry (11th Edition)AlgebraISBN:9780135163078Author:Michael SullivanPublisher:PEARSON
 Introduction to Linear Algebra, Fifth EditionAlgebraISBN:9780980232776Author:Gilbert StrangPublisher:Wellesley-Cambridge Press
 College Algebra (Collegiate Math)AlgebraISBN:9780077836344Author:Julie Miller, Donna GerkenPublisher:McGraw-Hill Education