
NESTER'S MICROBIOLOGY
9th Edition
ISBN: 9781264826940
Author: Anderson
Publisher: MCG
expand_more
expand_more
format_list_bulleted
Concept explainers
Videos
Textbook Question
Chapter 4, Problem 1CT
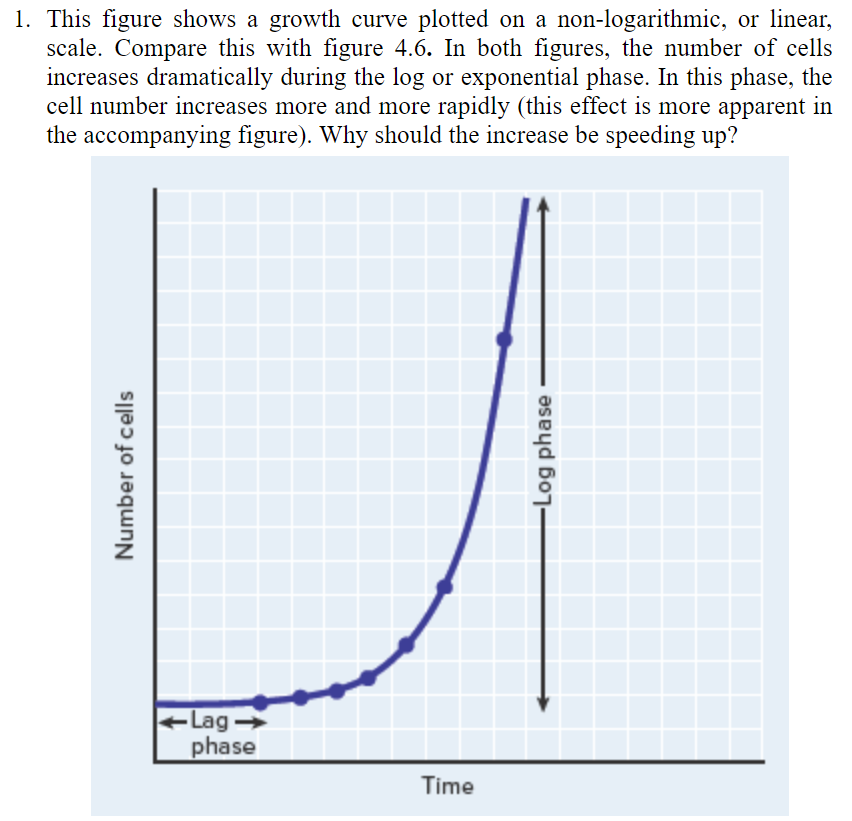
This figure shows a growth curve plotted on a non-logarithmic, or linear, scale. Compare this with figure 4.6. In both figures, the number of cells increases dramatically during the log or exponential phase. In this phase, the cell number increases more and more rapidly (this effect is more apparent in the accompanying figure). Why should the increase be speeding up?
Expert Solution & Answer
Want to see the full answer?
Check out a sample textbook solution
Students have asked these similar questions
+ Slider1
+ Slider2
108
107
106
105
104
30
60
90
120
150
180
210
240
Time in minutes
Determine the following:
1.
The shortest generation time (shortest cell doubling time, in mins) of the organism
2. The growth rate of the organism at the point where its generation time is shortest
3.
Describe the organism's growth curve using the numerical data you obtained from your calculations of
generation time and growth rate.
Cell numbers
The average size of cells during the exponential phase of growth is...
A) Less than the lag phase
B) Same as delay phase
C) Constant
Consider the growth curve shown below. Cells were grown in a medium
containing 1 % w/v glucose and 0.5% w/v acetate. Calculate the generation time
when growing on glucose and also when growing on acetate. Pay particular
attention to the split time axis with different time scales.
Glucose generation time =
hrs
Acetate generation time =
hrs
1011
1010
109
108
107
106
105
104
10
15 20 25 30
time (hours)
HA
log of numbers of bacteria
LO
Chapter 4 Solutions
NESTER'S MICROBIOLOGY
Ch. 4 - Describe a detrimental and a beneficial effect of...Ch. 4 - Define a pure culture.Ch. 4 - Prob. 3SACh. 4 - Explain how the environment of a colony differs...Ch. 4 - Prob. 5SACh. 4 - Why would botulism be a concern with canned foods?Ch. 4 - Explain why O2-containing atmospheres kill some...Ch. 4 - Explain why photoautotrophs are primary producers.Ch. 4 - Distinguish between a selective medium and a...Ch. 4 - Prob. 10SA
Ch. 4 - Prob. 1MCCh. 4 - Compared with their growth in the laboratory,...Ch. 4 -
3. Cells are most sensitive to penicillin during...Ch. 4 - Which best describes the intestinal tract? a) An...Ch. 4 - E. coli, a facultative anaerobe, is grown for 24...Ch. 4 - The generation time of a bacterium was measured at...Ch. 4 - Which of the following is false? a)E. coli grows...Ch. 4 -
8. If the pH indicator were left out of MacConkey...Ch. 4 -
9. A soil sample is placed in liquid and the...Ch. 4 -
10. If the concentration of E. coli in a broth is...Ch. 4 -
1. You are a microbiologist working for a...Ch. 4 - High-performance boat manufacturers know that...Ch. 4 - This figure shows a growth curve plotted on a...Ch. 4 - Prob. 2CT
Knowledge Booster


Learn more about
Need a deep-dive on the concept behind this application? Look no further. Learn more about this topic, biology and related others by exploring similar questions and additional content below.Similar questions
- Suppose that you were tasked with 4 cultures of a specific Bacteria Species in Luria Broth medium: (1) culture A – cells are in lag phase; (2) culture B – cell in log phase; (3) culture C – cells in stationary phase; and culture D – cells in decline phase. Imagine that you observe the growth rates of each culture in a fresh sterilized LB medium. Now, plot the outcome growth curves of cultures A, B, C and D in a single graph.arrow_forwardB) A total of 2.5 x 10⁵ cells were harvested from the patient. You need the cells to fill a scaffold with dimensions of 20mm x 20mm x 4mm at a final density of 2 x 10⁴ cells/mm³. After culturing the harvested cells, you found that they have a doubling time of 36 hours. Given the growth rate is proportional to the number of cells, determine the time it will take to achieve the desired cell count. Show your work.arrow_forwardAnswer the following question and choose the correct option: Which phase has the specific growth rate condition u = 0? A) Delay phase B) Stationary phase C) Death phasearrow_forward
- Calculate doubling time (td) and specific growth rate (μ) by using logarithmic growth stage.arrow_forwardPlateau Phase Death Lag Phase Exponential Growth Phase Phase Fen ve cels Many ive cets Dead cells 10 15 20 25 30 35 40 45 Hours Consider the above figure which depicts the growth curve of microorganisms such as Saccharomyces cerevisiae. Now, reflect upon the components which make up the growth medium used to cultivate yeast. Whilst the growth medium was being made, the component which provides a source of energy for yeast was omitted. VWhat component was left out? What effect will this have on the growth curve phases and the rate at which they occur, especially in regard to the 'Exponential Growth' phase of the yeast? Loganmm/10of Vahie Celsarrow_forwardAn organism produced the following growth pattern when grown at different pH's. The best description for this organism is: Key: 0 = no growth + = light growth ++ = medium growth +++ = heavy growth pH 1 3 5 7 9 11 Growth 0 0 + + ++ +++ Group of answer choices Alkaline-tolerant neutrophile Obligate alkalinophile Acid-tolerant neutrophile Neutrophile Acid-tolerant alkalinophilearrow_forward
- ery t ess Which method of counting cells would you use for each of these situations? Viable Cell Count Optical Density measurement Direct cell count [Choose ] [Choose ] ✓ [Choose ] You are attempting to quantify the ability of cleaning agents to kill bacteria in a liquid culture You are attempting to determine the doubling time of Escherichia coli in various liquid media You are attempting to quantify the ratio of contaminating rod-shaped cells in your culture of spherical Staphylococcuarrow_forwardThis is the growth curve for Clostirdium (incubated under optimal growth conditions). Use it to answer the following questions. 3 Cell concentration (million cells/ml) 2.5 2 0.2 1.5 1 0.5 0 2 The growth rate is lag log 0.25 4 0.32 0.5 units 6 million of cells per ml (Image description.: Horizontal axis is time in hours, Vertical is cell concentration in millions of cells per ml. Curve starts at 0,0, increases by 4 hours to 0.5 million cells/ml, goes up steeply over two hours from 0.5 million/ml at 4 hours to 2.5 million cells/ml at 8 hours, 8-12 hour shows an increase of 0.3 to 2,8 million cellls/ml and last 2 hours is flat at 2.8million cells/ml.) From 12 hr to 14 hr is called phase. lunar 2 8 Time (hours) 10 5 stationary 12 cells 14 death 16 million of cells per ml per hour hours million of cellsarrow_forwardThe death of Geobacillus stearothermophilus spores is routinely used to assess the effectiveness of sterilization procedures. In this procedure, endospores are exposed to the sterilization process (e.g., autoclaving) and then plated on germination medium. If sterilization has been successful, no growth occurs. This requires about 2 days. Yung and Ponce have developed a new approach that yields results within 15 minutes after sterilization. Their technique is based on the release of dipicolinic acid (DPA) from the spore coat by germinating cells. DPA release is monitored microscopically after endospores are placed in media containing alanine and terbium ion (Tb31). Alanine triggers germination and Tb31 binds DPA, which then fluoresces green when illuminated with UV light. Design an experiment in which this new method could be shown to be as reliable as the culturebased approach. What other sterilization procedures besides autoclaving could this technique be used to monitor?arrow_forward
- All of the following are valid measurements of growth except: A. Counting viable cells B. Estimating the weight of cells C. Determining the dry weight of cells D. Streaking for single colonies E. Measuring some cellular component F. Counting the total number of cellsarrow_forwardB) A total of 2.5 x 10⁵ cells were harvested from the patient. You need the cells to fill a scaffold with dimensions of 20mm x 20mm x 4mm at a final density of 2 x 10⁴ cells/mm³. After culturing the harvested cells, you found that they have a doubling time of 36 hours. Determine the total number of cells (N) needed to fill the scaffold. Show your work.arrow_forwardWhich growth condition shown above has the largest doubling time? How would you explain the observed growth data based on information about metabolism and oxygen requirements? Definitely take into consideration the relative growth of all three growth conditions. Surprisingly, cultures grown in anerobic conditions are non-motile, whereas cultures grown in normal O2 saturation have several peritrichous flagella and swim motility. Explain briefly the mechanism of flagellar motility in terms of energy source for flagellar motility and why it may be lower in anaerobic conditions for L. monocytogenes.arrow_forward
arrow_back_ios
SEE MORE QUESTIONS
arrow_forward_ios
Recommended textbooks for you
 Human Anatomy & Physiology (11th Edition)BiologyISBN:9780134580999Author:Elaine N. Marieb, Katja N. HoehnPublisher:PEARSON
 Biology 2eBiologyISBN:9781947172517Author:Matthew Douglas, Jung Choi, Mary Ann ClarkPublisher:OpenStax
 Anatomy & PhysiologyBiologyISBN:9781259398629Author:McKinley, Michael P., O'loughlin, Valerie Dean, Bidle, Theresa StouterPublisher:Mcgraw Hill Education,
 Molecular Biology of the Cell (Sixth Edition)BiologyISBN:9780815344322Author:Bruce Alberts, Alexander D. Johnson, Julian Lewis, David Morgan, Martin Raff, Keith Roberts, Peter WalterPublisher:W. W. Norton & Company
 Laboratory Manual For Human Anatomy & PhysiologyBiologyISBN:9781260159363Author:Martin, Terry R., Prentice-craver, CynthiaPublisher:McGraw-Hill Publishing Co.
 Inquiry Into Life (16th Edition)BiologyISBN:9781260231700Author:Sylvia S. Mader, Michael WindelspechtPublisher:McGraw Hill Education
Human Anatomy & Physiology (11th Edition)
Biology
ISBN:9780134580999
Author:Elaine N. Marieb, Katja N. Hoehn
Publisher:PEARSON
Biology 2e
Biology
ISBN:9781947172517
Author:Matthew Douglas, Jung Choi, Mary Ann Clark
Publisher:OpenStax
Anatomy & Physiology
Biology
ISBN:9781259398629
Author:McKinley, Michael P., O'loughlin, Valerie Dean, Bidle, Theresa Stouter
Publisher:Mcgraw Hill Education,
Molecular Biology of the Cell (Sixth Edition)
Biology
ISBN:9780815344322
Author:Bruce Alberts, Alexander D. Johnson, Julian Lewis, David Morgan, Martin Raff, Keith Roberts, Peter Walter
Publisher:W. W. Norton & Company
Laboratory Manual For Human Anatomy & Physiology
Biology
ISBN:9781260159363
Author:Martin, Terry R., Prentice-craver, Cynthia
Publisher:McGraw-Hill Publishing Co.
Inquiry Into Life (16th Edition)
Biology
ISBN:9781260231700
Author:Sylvia S. Mader, Michael Windelspecht
Publisher:McGraw Hill Education
cell culture and growth media for Microbiology; Author: Scientist Cindy;https://www.youtube.com/watch?v=EjnQ3peWRek;License: Standard YouTube License, CC-BY