
CAMPBEL BIOLOGY:CONCEPTS & CONNECTIONS
10th Edition
ISBN: 9780136538820
Author: Taylor
Publisher: INTER PEAR
expand_more
expand_more
format_list_bulleted
Concept explainers
Videos
Textbook Question
Chapter 36, Problem 2CC
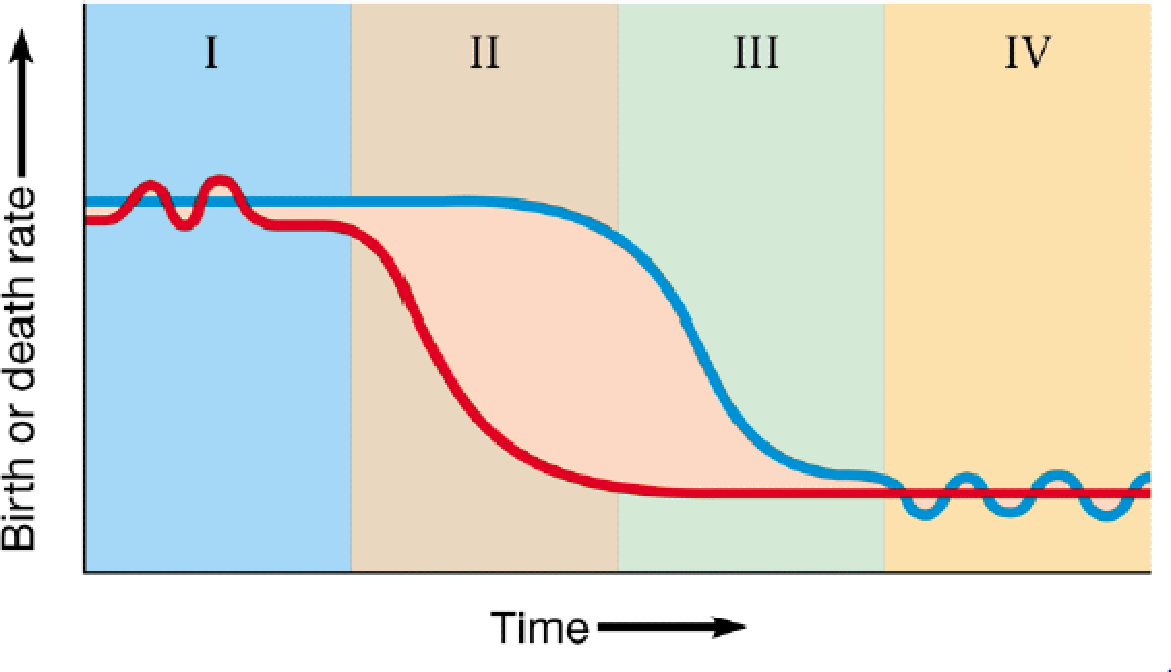
The graph below shows the demographic transition for a hypothetical country. Many developed countries that have achieved a stable
a. What does the blue line represent? The red line?
b. This diagram has been divided into four sections. Describe what is happening in each section.
c. In which section(s) is the population size stable?
d. In which section is the
Expert Solution & Answer

Trending nowThis is a popular solution!

Students have asked these similar questions
Use this graph of the idealized exponential and logistic growth curves to complete the following. a. Label the axes and curves on the graph.b. What does the dotted line represent? c. For each curve, indicate and explain where population growth is the most rapid. d. Which of these curves better represents global human population growth?
When an environment has reached its carying capacity for a certain population, which
of the following is true?
A. Growth and immigration rate is equal to death and emigration rate.
B. Growth and immigration rate is greater than death and emigration rate.
C. Growth and immigration rate is less than death and emigration rate.
D. Growth rate is exponential.
Answer
Why do you believe this is the correct
answer.
The curve below shows the growth rate of a population that
has a per capita growth rate of 0.4. Which of the following is
true about this curve. More than one is possible.
exponential growth
2500000
2000000
1500000
1000000
500000
0
5
10
15
20
25
Select one or more:
Ua. r becomes greater as the population grows because there are more births per year.
b. There are more births per generation as you move right on the graph
c. exponential growth is most often observed in stable populations that have resided in
an environment for a long time.
Od. The slope of the curve changes continuously as you move to the right even though r
remains the same.
Chapter 36 Solutions
CAMPBEL BIOLOGY:CONCEPTS & CONNECTIONS
Ch. 36 - Use this graph of the idealized exponential and...Ch. 36 - The graph below shows the demographic transition...Ch. 36 - Prob. 3TYKCh. 36 - To figure out the human population density of your...Ch. 36 - The term (K N)/K a. is the carrying capacity for...Ch. 36 - With regard to its rate of growth, a population...Ch. 36 - Which of the following represents a demographic...Ch. 36 - Skyrocketing growth of the human population...Ch. 36 - According to data on ecological footprints, a. the...Ch. 36 - What are some factors that might have a...
Knowledge Booster


Learn more about
Need a deep-dive on the concept behind this application? Look no further. Learn more about this topic, biology and related others by exploring similar questions and additional content below.Similar questions
- Write a model for discrete population growth from t=0 to t=1. Assume that the population is ‘closed’. Define your terms.arrow_forwardThe chart below shows selected population data for twodifferent countries, A and B. Study the chart and answerthe questions that follow Calculate the rates of natural increase (due to birthsand deaths, not counting immigration) for the populations of country A and country B. Based on thesecalculations and the data in the table, for each of thecountries, suggest whether it is a more-developedcountry or a less-developed country and explain thereasons for your answersarrow_forwardWrite a generalized model for exponential population growth. Define your terms. Then, draw a plot showing an example, being sure to label your axes. Write a formula that extends the preceding model to incorporate carrying capacity, producing sigmoidal population growth. Define your terms. Then, draw a plot showing an example, being sure to label your axes.arrow_forward
- The world population reached seven billion in 2011. At current growth rate, it is expected to reach eight billion by 2024 and nine billion by 2037. However, many projections predict that the world population will level off at around 9 billion individuals. Why is the world population expected to level off? Select one: a. The global fertility rate has been decreasing for the past 20 years and is expected to decline even further. b. More than a third of the world population is expected to be aged 60 years or above in 2100. c. The Earth’s carrying capacity is estimated at 9 billion individuals, when the global birth rate and death rate become equivalent. d. Recent technological and medical advances led to increased life expectancy, allowing individuals to live longer.arrow_forwardWhen discussing population size, we are referring to a. the total number of individuals in a population. b. the size of the geographic region in which a population is found. c. the number of individuals in a population divided by the area of the region covered by the population. d. the number of individuals in a population multiplied by the area of the region covered by the population. e. the specific type of environment in which a population can exist.arrow_forwardA population that grew in close relation to the amount of resources available in the environment, would experience A. exponential growth, such as shown on the J-shaped curve B. logistic growth, such as shown on the S-shaped curve C. unpredictable growth, such as shown on the ?-shaped curve D.logistic growth, such as shown on the J-shaped curve E. exponential growth, such as shown on the S-shaped curvearrow_forward
- The per capita birth (b) and death (d) rates are measured for two populations across a range of population sizes in the attached figure. The equation for exponential growth rate is dN/dt=rN where the per capita growth rate is r=(b-d). The equation for logistic population growth rate is dN/dt=rN(1-N/K). With logistic growth, r varies as a function of the population size with density-dependent birth and/or death rates. See attached image If the death rate decreased, what would happen to the population trajectory for population A? a) increase faster b) increase slower c) decrease faster d) decrease slowerarrow_forwardThe graph shows the worldwide human population from 1950 to 2050. Data for the future years are predictions. According to the ideas of Thomas Malthus, what are the predicted changes to the human population after 2050? A. The population would continue to increase at the same rate, due to constant food supplies. B. The population would increase more rapidly, due to advances in technology. C. Eventually the population would stop increasing or would decrease, due to lack of food and living space. D. Eventually the population would decrease to zero, because of war, famine, or disease.arrow_forwardDraw a graph with a growth curve for a population that starts at 10 individuals and experiences exponential growth. Draw a second graph with a growth curve for a population that starts with 10 individuals and undergoes logistic growth. The second graph should have a carrying capacity of 100 individuals. Please give a proper written explanation for the graphs.arrow_forward
- Please help me to get aswers thank you Define and give an example of each of the following. You may use examples from the Human Population Growth A) Density-dependent control on human population growth B) Density-independent control on human population growtharrow_forwardA population that did not grow in close relation to the amount of resources available in the environment, and dramatically overshot the carrying capacity, would experience: A. logistic growth, such as shown on the S-shaped curve B. exponential growth, such as shown on the J-shaped curve C. unpredictable growth, such as shown on the ?-shaped curve D. exponential growth, such as shown on the S-shaped curve E.logistic growth, such as shown on the J-shaped curvearrow_forwardWrite a conclusion that includes an analysis of various limiting factors and how they impacted population growth. State the purpose of the experiment using the question. Explain the background of the experiment and briefly describe the procedure. When explaining the background of the experiment, you are giving a overview of limiting factors. You should include information found in the background of the lab. Include a summary of the steps used to gather data. Describe how each of the limiting factors you studied in the simulation affected population growth and carrying capacity( migration, predation, food, disease, and pollution) include a reason why you think the limiting factor affected the population growth in this way.arrow_forward
arrow_back_ios
SEE MORE QUESTIONS
arrow_forward_ios
Recommended textbooks for you
 Biology (MindTap Course List)BiologyISBN:9781337392938Author:Eldra Solomon, Charles Martin, Diana W. Martin, Linda R. BergPublisher:Cengage Learning
Biology (MindTap Course List)
Biology
ISBN:9781337392938
Author:Eldra Solomon, Charles Martin, Diana W. Martin, Linda R. Berg
Publisher:Cengage Learning
POPULATION REGULATION AND LIMITING FACTORS | DENSITY INDEPENDENT AND DENSITY DEPENDENT FACTORS; Author: BioVidyalaya;https://www.youtube.com/watch?v=mB-AB-5Wnhs;License: Standard YouTube License, CC-BY
Population growth; Author: SiouxScience;https://www.youtube.com/watch?v=XnaC9iOumVA;License: Standard YouTube License, CC-BY