
CAMPBEL BIOLOGY:CONCEPTS & CONNECTIONS
10th Edition
ISBN: 9780136538820
Author: Taylor
Publisher: INTER PEAR
expand_more
expand_more
format_list_bulleted
Concept explainers
Videos
Textbook Question
Chapter 36, Problem 12TYK
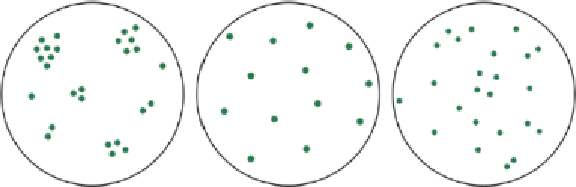
Describe the factors that might produce the following three types of dispersion patterns in populations.
Expert Solution & Answer
Want to see the full answer?
Check out a sample textbook solution
Students have asked these similar questions
In Population Attributable Risk, what are the equations for It and Pe? When
would you use these variables? How do you chose whether or not which value to
use?
What’s the difference between density dependent and density independentlimiting factors?
Compare the 95% confidence interval for the difference between two true means with the 95% confidence interval for an individual true kean. Describe one way in which these two equations are similar and state four ways in which these equations differ.
Chapter 36 Solutions
CAMPBEL BIOLOGY:CONCEPTS & CONNECTIONS
Ch. 36 - Use this graph of the idealized exponential and...Ch. 36 - The graph below shows the demographic transition...Ch. 36 - Prob. 3TYKCh. 36 - To figure out the human population density of your...Ch. 36 - The term (K N)/K a. is the carrying capacity for...Ch. 36 - With regard to its rate of growth, a population...Ch. 36 - Which of the following represents a demographic...Ch. 36 - Skyrocketing growth of the human population...Ch. 36 - According to data on ecological footprints, a. the...Ch. 36 - What are some factors that might have a...
Knowledge Booster


Learn more about
Need a deep-dive on the concept behind this application? Look no further. Learn more about this topic, biology and related others by exploring similar questions and additional content below.Similar questions
- Which of the following variables from the concept of Hardy Weinberg Equilibrium would you need to calculate for in order to figure out the frequency of the population of carriers in a region? O P^2 Q^2 P*Qarrow_forwardWhich of the following variables from the concept of Hardy Weinberg Equilibrium would you need to calculate for in order to figure out the frequency of the population of carriers in a region? P^2 Q^2 P*Q None of the abovearrow_forwardWhich of the following patterns of cars parked along a street is an example of uniform dispersion? (a) five cars parked next to one another in the middle, leaving two empty spaces at one end and three empty spaces at theother end (b) five cars parked in this pattern: car, empty space, car, empty space, and so on (c) five cars parked in no discernible pattern, sometimes having empty spaces on each side and sometimes parked next to another cararrow_forward
- The logistic model incorporates carrying capacity to make the model exponential density-dependent random density-independentarrow_forwardName and describe the three types of dispersion that can be found in a population b). c).arrow_forwardThe per capita birth (b) and death (d) rates are measured for two populations across a range of population sizes in the attached figure. The equation for exponential growth rate is dN/dt=rN where the per capita growth rate is r=(b-d). The equation for logistic population growth rate is dN/dt=rN(1-N/K). With logistic growth, r varies as a function of the population size with density-dependent birth and/or death rates. See attached image If the death rate decreased, what would happen to the population trajectory for population A? a) increase faster b) increase slower c) decrease faster d) decrease slowerarrow_forward
- Define the following and give examples of each:Density independent limiting factor - Density dependent limiting factor -arrow_forwardWhich graph give a more accurate Km and Vmax from the following graphs: Line-weaver Burke plot, Eadie Hofstee plot, or Hanes Woolf plot?arrow_forward71 y = 23.397 + 0.65027x 70 69 68 67 66 65 64 66 68 70 72 MidParent height (x) Mean height of adult Offspring (y)arrow_forward
- A region of North America has a population of 65,000 deer in 2016. The deer are kept in check by a wolf population. The carrying capacity of this region allows for 82,000 deer. For this example, assume the rmax is 1.0. With this information, answer/calculate the following:arrow_forwardUsing the following diagram, determine the value of the PA and P for this animal compared to the population. (You do not have to account for the mean as that is the line.) Ep = +5200 BV = +2300 GCV = -1500 Et= -1800 Phenotypic value (P-H) Producing ability (PA)arrow_forwardHow much of the population falls within 1 standard deviation of the mean on either side? 66% 95% 80% 85%arrow_forward
arrow_back_ios
SEE MORE QUESTIONS
arrow_forward_ios
Recommended textbooks for you
 Case Studies In Health Information ManagementBiologyISBN:9781337676908Author:SCHNERINGPublisher:Cengage
 Principles Of Radiographic Imaging: An Art And A ...Health & NutritionISBN:9781337711067Author:Richard R. Carlton, Arlene M. Adler, Vesna BalacPublisher:Cengage Learning
Case Studies In Health Information Management
Biology
ISBN:9781337676908
Author:SCHNERING
Publisher:Cengage
Principles Of Radiographic Imaging: An Art And A ...
Health & Nutrition
ISBN:9781337711067
Author:Richard R. Carlton, Arlene M. Adler, Vesna Balac
Publisher:Cengage Learning
Ecology: Interspecific and Intraspecific Interactions | Ecology & Environment | Biology | FuseSchool; Author: FuseSchool - Global Education;https://www.youtube.com/watch?v=IiQTrA0-TE8;License: Standard YouTube License, CC-BY