
Concept explainers
Videos
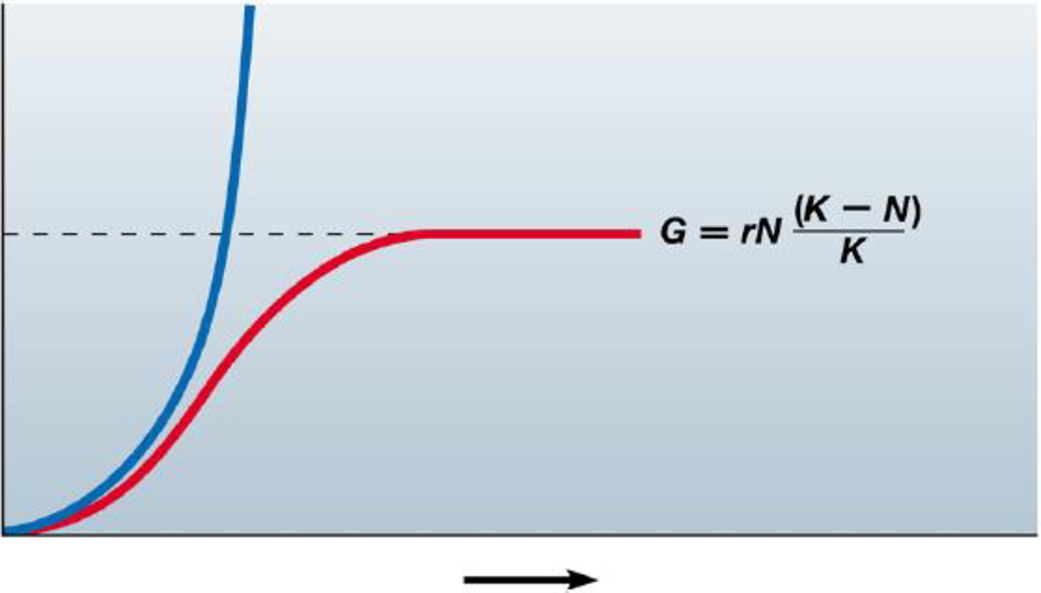
Use this graph of the idealized exponential and
a. Label the axes and curves on the graph.
b. Give the formula that describes the blue curve.
c. What does the dotted line represent?
d. For each curve, indicate and explain where population growth is the most rapid.
e. Which of these curves best represents global human population growth?
a.
To label: The axis and the curves of the graph.
Introduction: Exponential growth curve is the J-shaped curve that is ever increasing in nature. The logistic growth curve is an S shaped curve in which the growth of the population ceases after a certain point which can be represented as the carrying capacity of the population.
Answer to Problem 1CC
Correct answer:
X-axis is time, Y-axis is population size. Blue/thick curve is the exponential growth and red/thin curve is logistic curve
Explanation of Solution
Graphical representation: Fig: 1 shows the graph depicting the logistic and exponential growth curve.
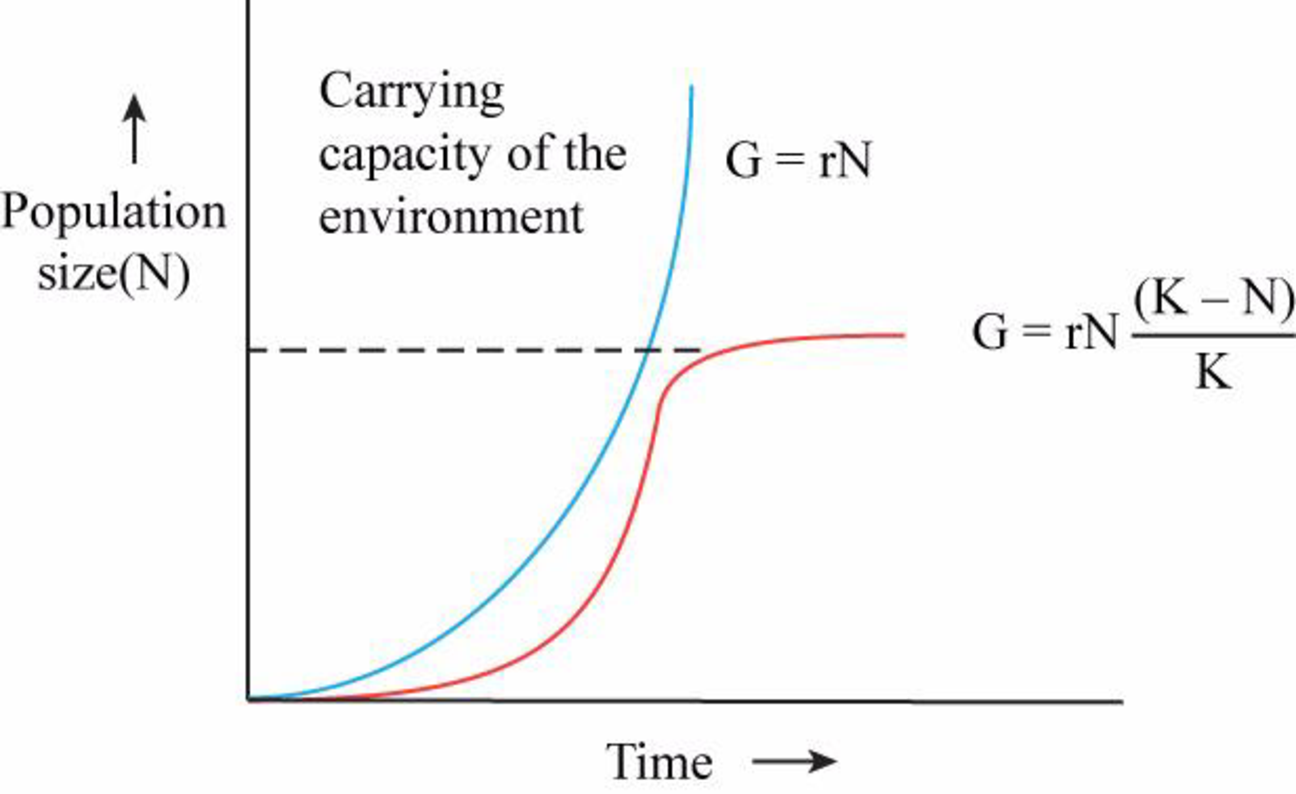
Fig. 1: The graph depicting the logistic and exponential growth curve.
The X-axis of the graph represents the time taken for growth and the Y-axis of the graph represents the size of the population. The blue/thick curve is the exponential growth curve and red/thin curve is logistic growth curve. Hence the correct answer is X-axis is time, Y-axis is population size. Blue/thick curve is the exponential growth and red/thin curve is logistic curve
b.
To give: The formula that describes the blue curve.
Answer to Problem 1CC
Correct answer:
Explanation of Solution
Refer to Fig.1; the blue curve can be described by the formula
c.
To determine: What does the dotted line represents.
Answer to Problem 1CC
Correct answer:
Carrying capacity of the environment (K)
Explanation of Solution
Refer to Fig.1; the dotted line represented on the graph is the carrying capacity of the environment. Hence the correct answer is carrying capacity of the environment (K)
d.
To determine: What does each curve represents.
Answer to Problem 1CC
Correct answer:
Population of logistic curve is most rapid at half of the carrying capacity. Population of exponential growth is most rapid throughout the curve as it is continuously increasing.
Explanation of Solution
Refer to Fig.1; the population growth is most rapid when population attains half of the carrying capacity in logistic curve and the population growth is continuously increasing in the exponential growth curve. Hence the correct answer half of the carrying capacity in logistic curve and continuous growth in exponential growth.
e.
To determine: The curve which represents the global human population.
Answer to Problem 1CC
Correct answer:
Exponential growth curve
Explanation of Solution
Refer to Fig.1; it is the J shaped curve that is continuously increasing is the exponential growth curve. The worldwide population can be represented by this curve as the population is ever increasing. Hence the correct answer is exponential growth curve.
Want to see more full solutions like this?
Chapter 36 Solutions
CAMPBEL BIOLOGY:CONCEPTS & CONNECTIONS


 Human Anatomy & Physiology (11th Edition)BiologyISBN:9780134580999Author:Elaine N. Marieb, Katja N. HoehnPublisher:PEARSON
 Biology 2eBiologyISBN:9781947172517Author:Matthew Douglas, Jung Choi, Mary Ann ClarkPublisher:OpenStax
 Anatomy & PhysiologyBiologyISBN:9781259398629Author:McKinley, Michael P., O'loughlin, Valerie Dean, Bidle, Theresa StouterPublisher:Mcgraw Hill Education,
 Molecular Biology of the Cell (Sixth Edition)BiologyISBN:9780815344322Author:Bruce Alberts, Alexander D. Johnson, Julian Lewis, David Morgan, Martin Raff, Keith Roberts, Peter WalterPublisher:W. W. Norton & Company
 Laboratory Manual For Human Anatomy & PhysiologyBiologyISBN:9781260159363Author:Martin, Terry R., Prentice-craver, CynthiaPublisher:McGraw-Hill Publishing Co.
 Inquiry Into Life (16th Edition)BiologyISBN:9781260231700Author:Sylvia S. Mader, Michael WindelspechtPublisher:McGraw Hill Education